Many people are asking what is the required hardware configuration for Apache Kafka especially on container platform like OpenShift. There is no simple answer for the question because there are so many factors to consider which only become clear after the design and implementation is completed. The best answer is to do an initial high level guesstimation and later to perform a proper load testing before your implementation goes into production environment.
I am planning to do a proper performance load test for Red Hat AMQ Streams on OpenShift so that I have answers for the guesstimation. But before I can do that, I need a proper performance load testing tool and an easier way to monitor and measure the performance metics. So I begin the journey to hunt for the load testing tool.
Note that Red Hat AMQ Streams is the Red Hat commercial version of Apache Kafka. I will use the name of Kafka which refers to AMQ Streams in the rest of this article.
Initially, I was using the performance test tool (kafka-producer-perf-test.sh) provided by Kafka. It is nicely done tool with many options for Kafka settings. However I quickly find that it is lacking the control, flexibility and friendliness when come to load testing, especially when you need to have knowledge of more performance metrics than just number of messages per second, or when you need to control the number of users / threads. It is even better if you are able to have integrated monitoring tools that provides you an easy to read performance metrics.
When come to performance load testing tool, people usually think of Apache JMeter. I am not a frequent JMeter user. However I think it will not be wrong to give JMeter a try since it is one of the most popular tool around. So I started to research on Apache JMeter for Kafka load testing and the good news is we can use JSR223 to implement Kafka client using Java codes, my favourite. Another good news is we can run Apache JMeter as command line interface without UI, which is exactly what we want for container. JMeter is also being able to control the load testing parameters via the command line properties. Perfect candidate!
Next, I started to build JMeter into container and use it to load test Kafka on OpenShift, and it works. Please read on for more excitements.
Please be noted that always refer to the GitHub project for updated content. This article maybe outdated fast due to changes progress at GitHub project.
Creating and Building JMeter Container with Apache Kafka Client
JMeter Test Plan
To run the load test for Kafka, we need to create a JMeter test plan using the JSR223 to implement some Kafka client Java codes. In order to do that, you need to download the necessary Kafka client jar and place it in the JMeter lib directory.
In order to monitor the JMeter performance via Prometheus, you need to enable JMeter exporter for Prometheus. Download the JMeter exporter jar and place it in the JMeter lib/ext directory. Once this is done, you should be able add Prometheus Listener via the drop down menu.
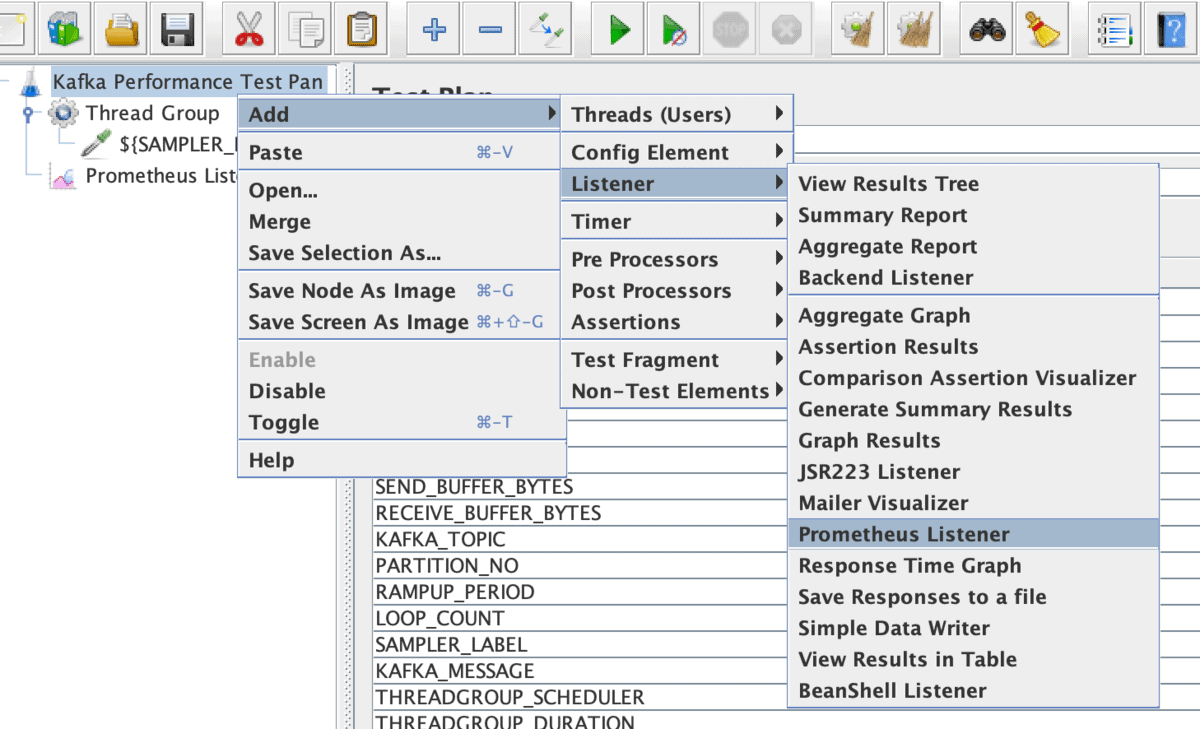
The following screens show how the test plan looks like. You can access a copy of this test plan at the GitHub.
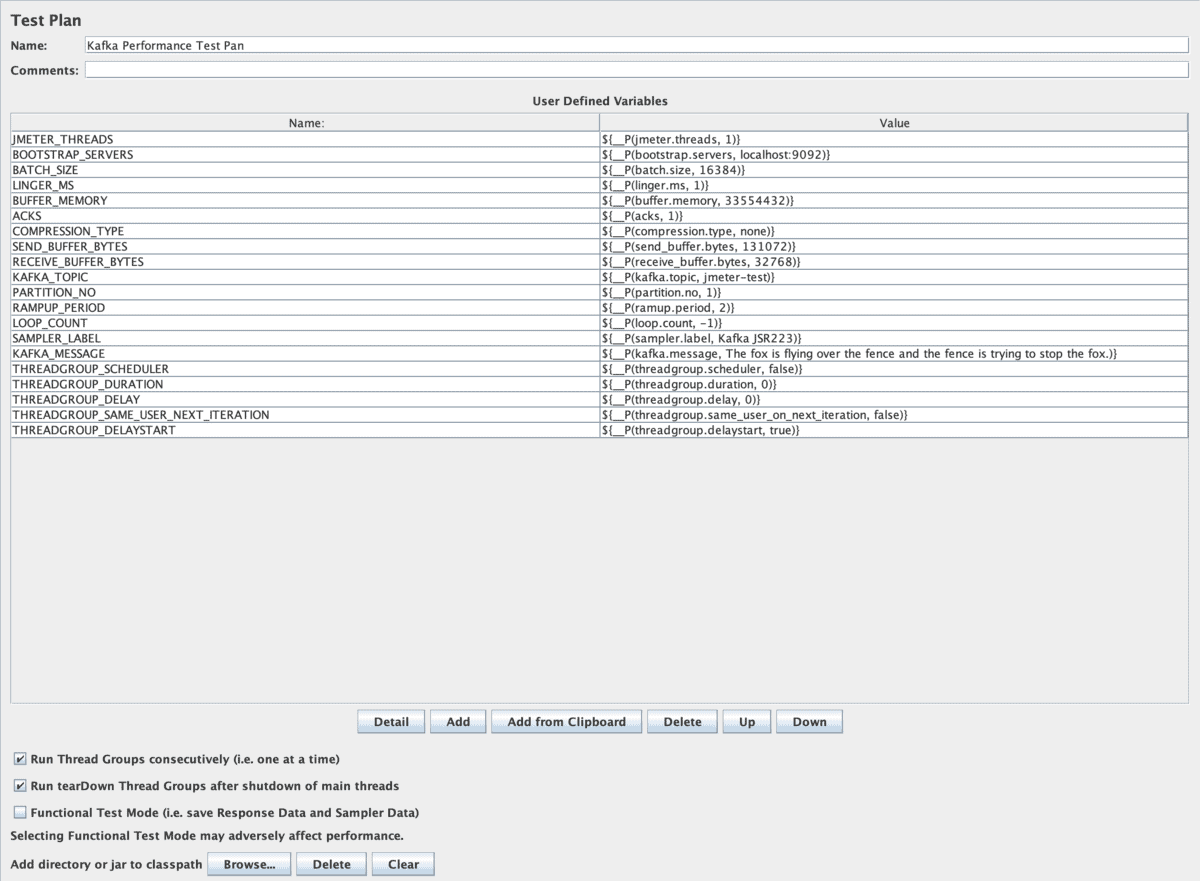
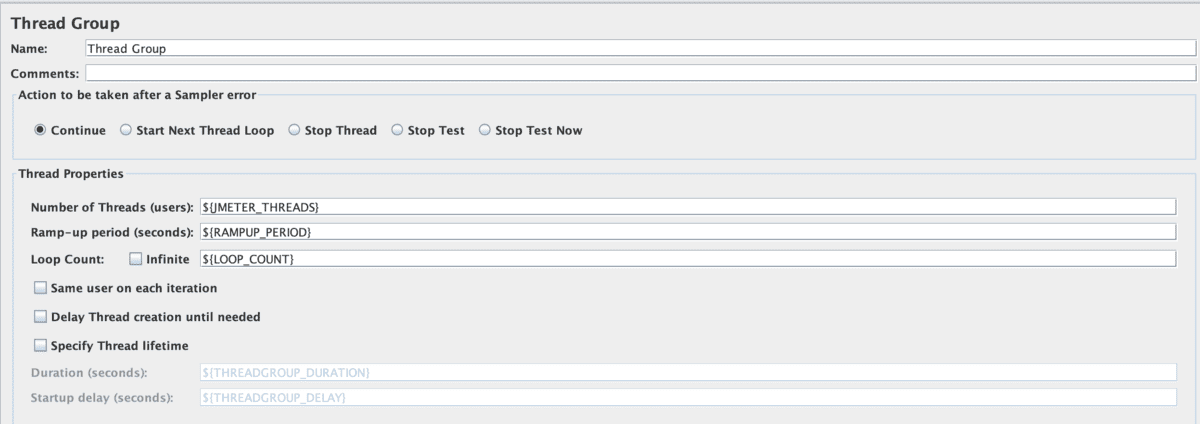
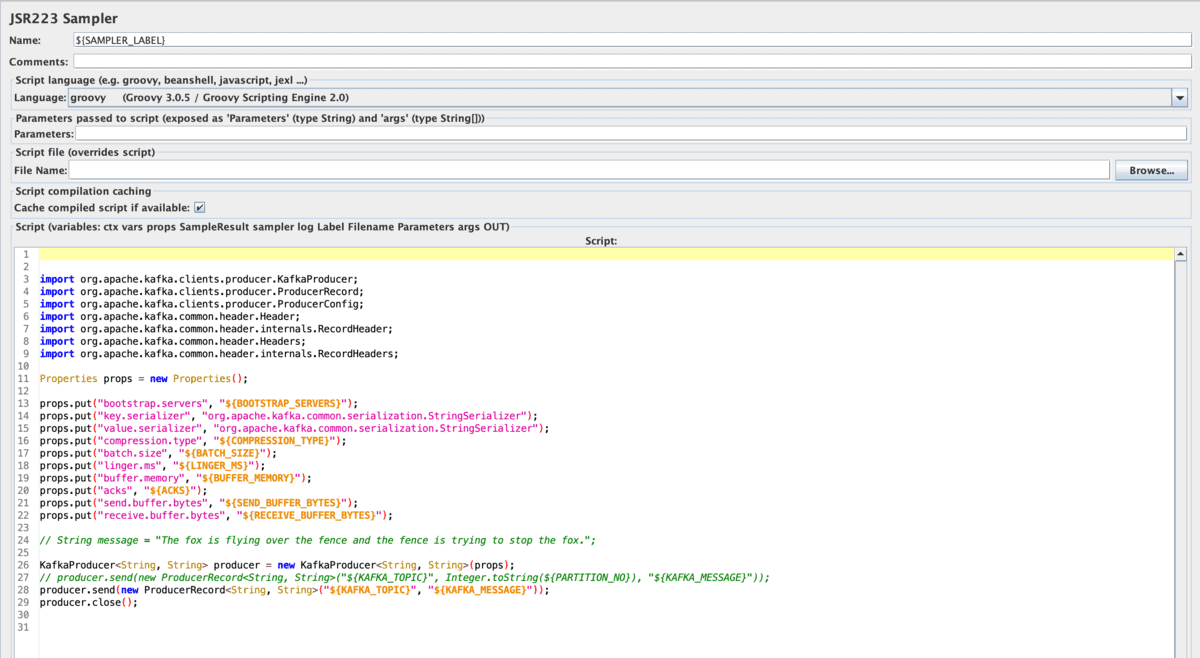

Dockerfile
You can create Dockerfile with the following content. In this case, I am using JMeter 5.4.1, Kafka Client 2.7.0 and JMeter Exporter for Prometheus 0.6.0.
I am using the UBI 8 OpenJDK container base image from Red Hat. You may use other container image as long as they provide the supported JVM required for JMeter and Kafka Client. The Kafka Client jar file should be placed in the JMeter lib directory and the JMeter Exporter for Prometheus jar file should be placed in the JMeter lib/ext directory.
FROM registry.access.redhat.com/ubi8/openjdk-11

ARG JMETER_VERSION="5.4.1"
ARG KAFKA_CLIENT_VERSION="2.7.0"
ARG PROMETHEUS_PLUGIN_VERSION="0.6.0"

LABEL name="JMeter - with Apache Kafka Load Teat Tool" \
      vendor="Apache" \
      io.k8s.display-name="JMeter - with Apache Kafka Load Teat Tool" \
      io.k8s.description="Load test using JMeter for Apache Kafka" \
      summary="Load test using JMeter for Apache Kafka" \
      io.openshift.tags="jmeter" \
      build-date="2021-03-10" \
      version="${JMETER_VERSION}" \
      kafkaclientversion="${KAFKA_CLIENT_VERSION}" \
      release="1" \
      maintainer="CK Gan <[email protected]>"

USER root

RUN microdnf install wget

# container volume
#ENV JMETER_DATA /jmeter-data
ENV JMETER_HOME /opt/jmeter
ENV JMETER_BIN ${JMETER_HOME}/bin
ENV JMETER_TESTPLANS=${JMETER_HOME}/testplans
ENV JMETER_RESULTS=/tmp/jmeter-results
ENV PATH $JMETER_BIN:$PATH
ENV HEAP "-Xms512m -Xmx2048m"

RUN cd /opt && wget https://downloads.apache.org//jmeter/binaries/apache-jmeter-${JMETER_VERSION}.tgz && \
tar -xvzf apache-jmeter-${JMETER_VERSION}.tgz && \
rm apache-jmeter-${JMETER_VERSION}.tgz && \
mv apache-jmeter-${JMETER_VERSION} ${JMETER_HOME}

RUN wget https://repo1.maven.org/maven2/org/apache/kafka/kafka-clients/${KAFKA_CLIENT_VERSION}/kafka-clients-${KAFKA_CLIENT_VERSION}.jar && mv kafka-clients-${KAFKA_CLIENT_VERSION}.jar ${JMETER_HOME}/lib/

RUN wget https://repo1.maven.org/maven2/com/github/johrstrom/jmeter-prometheus-plugin/${PROMETHEUS_PLUGIN_VERSION}/jmeter-prometheus-plugin-${PROMETHEUS_PLUGIN_VERSION}.jar && mv jmeter-prometheus-plugin-${PROMETHEUS_PLUGIN_VERSION}.jar ${JMETER_HOME}/lib/ext/

RUN mkdir -p ${JMETER_TESTPLANS}
COPY ./testplans/* ${JMETER_TESTPLANS}/
COPY ./run.sh ${JMETER_BIN}/
RUN chmod +x ${JMETER_BIN}/run.sh

CMD ${JMETER_BIN}/run.sh
The JMeter Exporter for Prometheus plugin is highly configurable listener (and config element) to allow users define they’re own metrics (names, types etc.) and expose them through a Prometheus /metrics API to be scraped by a Prometheus server. This is one of the recommended exporter by Grafana.
Note that at the end of the Dockerfile, the run.sh bash script is executed to run jmeter command in non-UI mode. As shown below, this give you a bunch of necessary parameters that you can pass into the container when you use it to perform the Kafka load testing.
#!/bin/bash

echo
echo "Creating the following path in container volume ..."
echo "     JMeter Result Path: $JMETER_RESULTS"
echo
mkdir -p $JMETER_RESULTS

echo "Current HEAP settings ..."
echo "HEAP=$HEAP"

for FILE in $JMETER_TESTPLANS/*;
    do
        echo
        echo "Executing test plan: $FILE ..."
        echo
        echo "command: jmeter -n -t $FILE -l $JMETER_RESULTS/kafka-jmeter-result.jtl -Jjmeter.threads=$JMETER_THREADS -Jbootstrap.servers=$BOOTSTRAP_SERVERS -Jbatch.size=$BATCH_SIZE -Jlinger.ms=$LINGER_MS -Jbuffer.memory=$BUFFER_MEMORY -Jacks=$ACKS -Jcompression.type=$COMPRESSION_TYPE -Jsend_buffer.bytes=$SEND_BUFFER -Jreceive_buffer.bytes=$RECEIVE_BUFFER -Jkafka.topic=$KAFKA_TOPIC -Jpartition.no=$PARTITION_NO -Jramup.period=$RAMUP_PERIOD -Jloop.count=$LOOP_COUNT -Jprometheus.port=$PROMETHEUS_PORT -Jprometheus.ip=$PROMETHEUS_HOST -Jsampler.label=$SAMPLER_LABEL -Jkafka.message=$KAFKA_MESSAGE;"

        jmeter -n -t $FILE -l $JMETER_RESULTS/kafka-jmeter-result.jtl \
        -Jjmeter.threads=$JMETER_THREADS \
        -Jbootstrap.servers=$BOOTSTRAP_SERVERS \
        -Jbatch.size=$BATCH_SIZE \
        -Jlinger.ms=$LINGER_MS \
        -Jbuffer.memory=$BUFFER_MEMORY \
        -Jacks=$ACKS \
        -Jcompression.type=$COMPRESSION_TYPE \
        -Jsend_buffer.bytes=$SEND_BUFFER \
        -Jreceive_buffer.bytes=$RECEIVE_BUFFER \
        -Jkafka.topic=$KAFKA_TOPIC \
        -Jpartition.no=$PARTITION_NO \
        -Jramup.period=$RAMUP_PERIOD \
        -Jloop.count=$LOOP_COUNT \
        -Jprometheus.port=$PROMETHEUS_PORT \
        -Jprometheus.ip=$PROMETHEUS_HOST \
        -Jsampler.label=$SAMPLER_LABEL \
        -Jkafka.message=$KAFKA_MESSAGE \
        -Jthreadgroup.scheduler=$THREADGROUP_SCHEDULER \
        -Jthreadgroup.duration=$THREADGROUP_DURATION \
        -Jthreadgroup.delay=$THREADGROUP_DELAY \
        -Jthreadgroup.same_user_on_next_iteration=$THREADGROUP_SAME_USER_NEXT_ITERATION \
        -Jthreadgroup.delaystart=$THREADGROUP_DELAYSTART;
done
Build the JMeter Container
To build the container using Docker or Podman. Run the following command from the root directory of the project files.
docker build -t chengkuan/jmeter-kafka:1.0 .podman build -t chengkuan/jmeter-kafka:1.0 .Test Run JMeter Container Locally
Now with the JMeter container ready, we can proceed to perform some testing locally. Before that, to showcase the complete action, you will need to setup the following servers.
- Apache Kafka – Refer quick start for simple setup.
- Prometheus – I am running Prometheus as Docker container.
- Grafana – I am running Grafana as Docker container.
I also make sure that I have enabled the Kafka JMX exporter for Prometheus in my local Apache Kafka. Please head to the JMX exporter GitHub site and download the jar file and copy it into the Kafka lib/ext directory.
Modify the Kafka start-server-start.sh to include the following export command. Perform the same step for Zookeeper.
# JMX Exporter for Prometheus
export KAFKA_OPTS="-javaagent:/$KAFKA_HOME/prometheus_agent/jmx_prometheus_javaagent-0.15.0.jar=9308:/$KAFKA_HOME/prometheus_agent/kafka-2_0_0.yml"
Create a copy of the following file for the Prometheus scrape configuration to scrape JMeter, Kafka Broker and Zookeeper. I have created a sample YAML file in the GitHub. You need to bind-mount this .yml file when you start the Prometheus container.
Please refer to Prometheus documentation for more detail.
# my global config
global:
  scrape_interval:     15s # Set the scrape interval to every 15 seconds. Default is every 1 minute.
  evaluation_interval: 15s # Evaluate rules every 15 seconds. The default is every 1 minute.
  # scrape_timeout is set to the global default (10s).

# Alertmanager configuration
alerting:
  alertmanagers:
  - static_configs:
    - targets:
      # - alertmanager:9093

# Load rules once and periodically evaluate them according to the global 'evaluation_interval'.
rule_files:
  # - "first_rules.yml"
  # - "second_rules.yml"

# A scrape configuration containing exactly one endpoint to scrape:
# Here it's Prometheus itself.
scrape_configs:
  # The job name is added as a label `job=<job_name>` to any timeseries scraped from this config.
  - job_name: 'prometheus'

    # metrics_path defaults to '/metrics'
    # scheme defaults to 'http'.

    static_configs:
    - targets: ['localhost:9090']
  - job_name: 'jmeter'
    # metrics_path defaults to '/metrics'
    # scheme defaults to 'http'.
    static_configs:
    - targets: ['192.168.1.118:9270']
  - job_name: 'kafka'
    # metrics_path defaults to '/metrics'
    # scheme defaults to 'http'.
    static_configs:
    - targets: ['192.168.1.118:9308']
  - job_name: 'zookeeper'
    # metrics_path defaults to '/metrics'
    # scheme defaults to 'http'.
    static_configs:
    - targets: ['192.168.1.118:9309']
With the Grafana running, import the following sample dashboards for JMeter and Kafka. Please refers to the GitHub List of Files section for more detail.
With all the necessary servers started locally, execute the following command to run the JMeter container. Please refer to the GitHub for this project on additional parameters that you can use. In this example, I am exposing the port 9270 for the JMeter Exporter for Prometheus. I have pre-created a Kafka topic named jmeter-test-3p.
docker run -p 9270:9270 -e "JMETER_THREADS=1" -e "BOOTSTRAP_SERVERS=192.168.0.118:9092" -e "PROMETHEUS_PORT=9270" -e "PROMETHEUS_HOST=0.0.0.0" -e "RAMUP_PERIOD=1" -e "LOOP_COUNT=-1" -e "KAFKA_TOPIC=jmeter-test-3p" -e "SAMPLER_LABEL=Test-3P" -e "KAFKA_MESSAGE=This-is-a-test-message" -it chengkuan/jmeter-kafka:1.0If all run fine, you should see the following output from the container
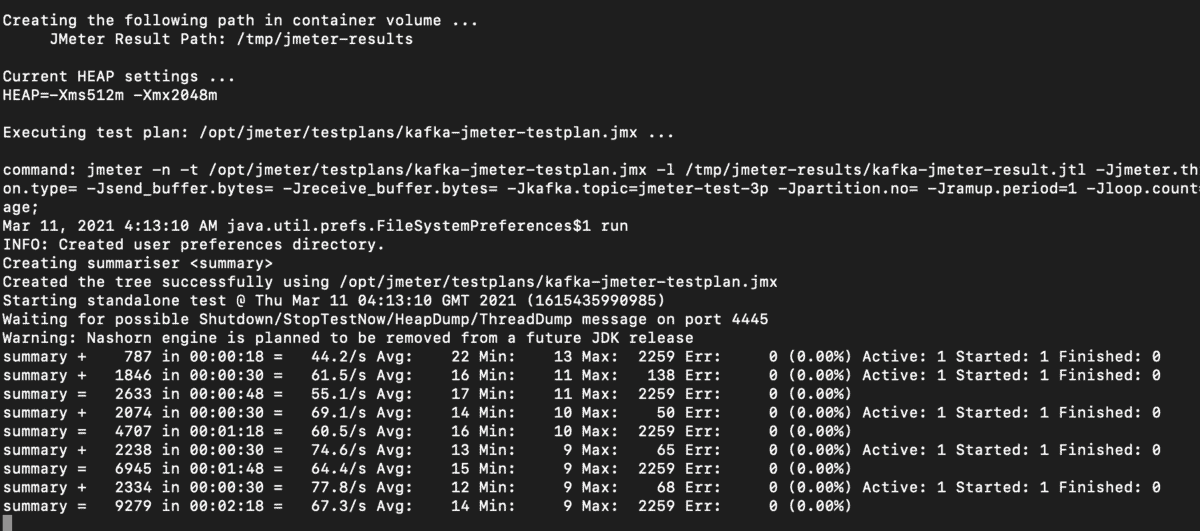
Run the Kafka consumer with the following consuming to jmeter-test-3p topic. You should be able to see the messages coming in.
bin/kafka-console-consumer.sh --topic jmeter-test-3p --bootstrap-server 192.168.118:9092You should see the following displays indicate all working as expected locally.
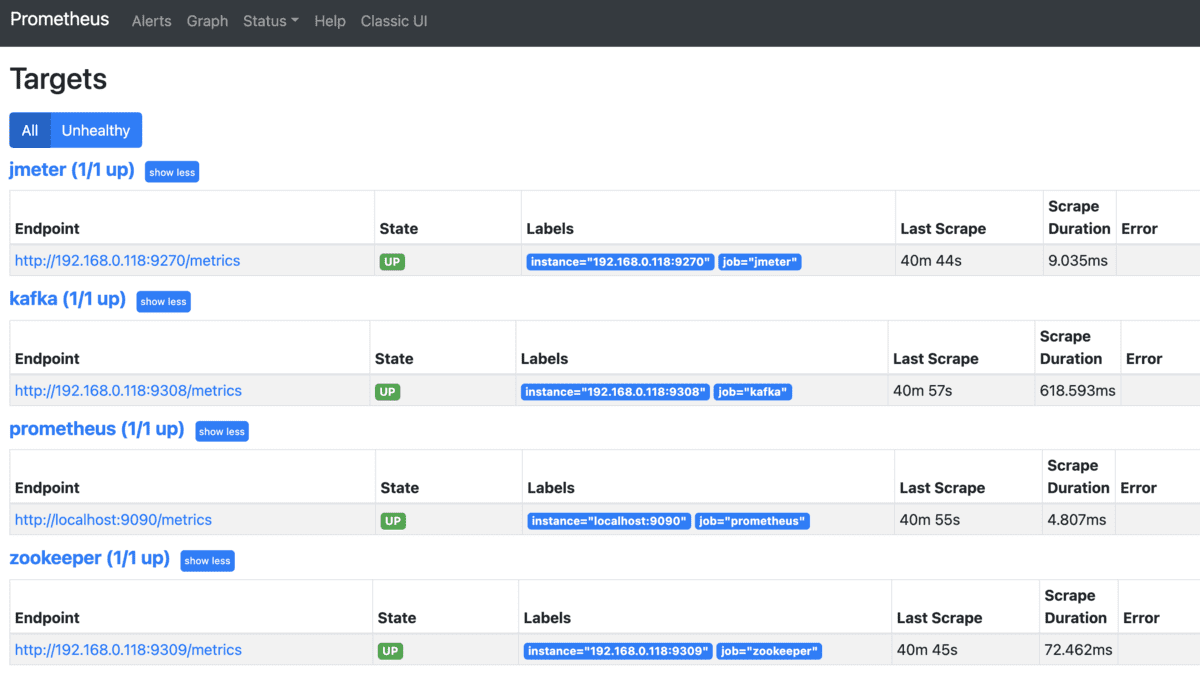
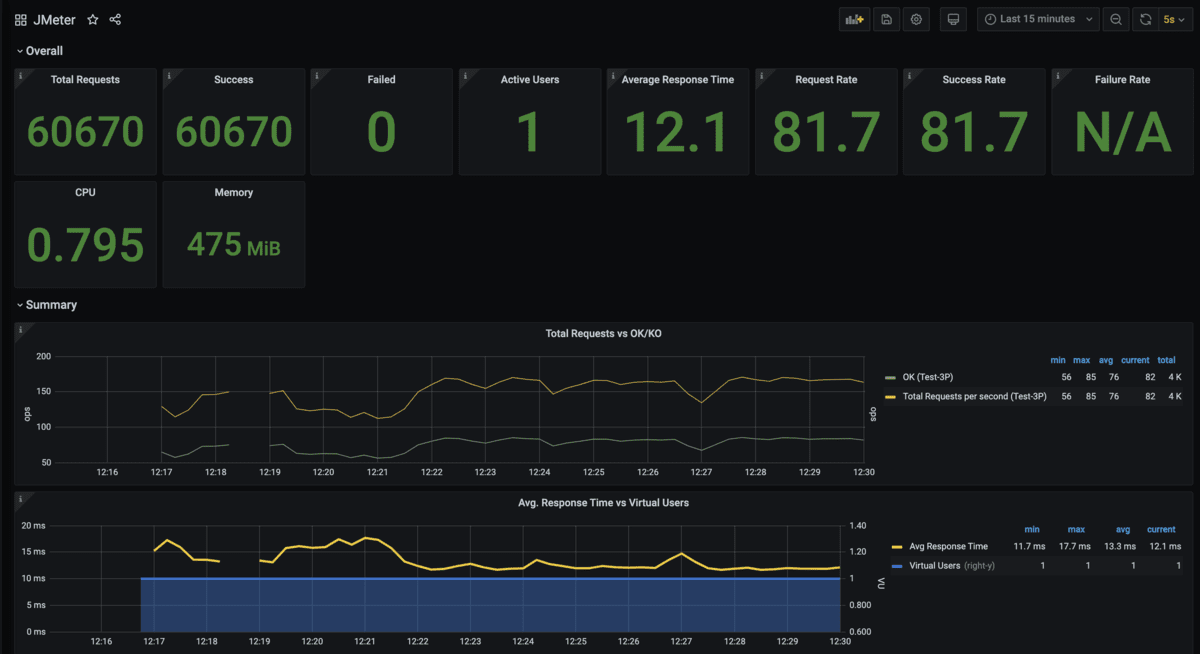
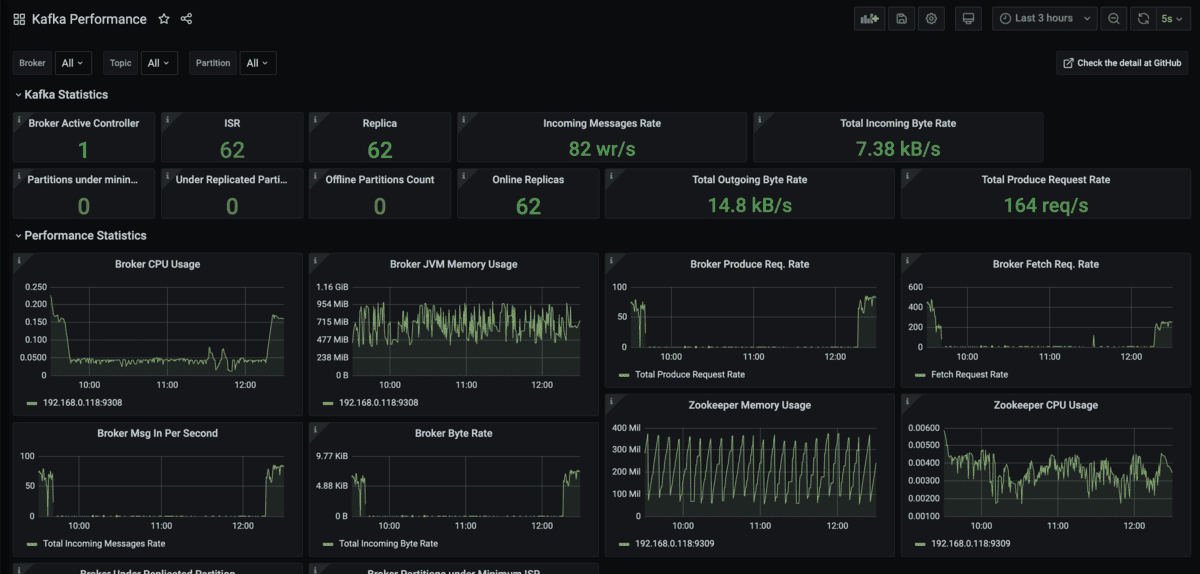
Next, let’s look at how can we run the JMeter container on OpenShift.
Deploying JMeter Container on OpenShift
Again, before we proceed, make sure you have your OpenShift Container Platform ready with the following:
- Red Hat AMQ Streams is deployed with a topic. You can deploy and configure this using the provided Red Hat AMQ Streams Operator.
- Prometheus is configured. There is new approach to configure Prometheus to use OpenShift embedded version on OpenShift 4.6 onwards. Refer this documentation for how to configure this.
- Grafana is configured. You can now configure custom Grafana to refer to the OpenShift Prometheus as data source and create your own custom dashboard. Refer this for some of the idea for how to do this.
I have created a script to configure the OpenShift environment in the GitHub, please refer to GitHub content if you wish to jumpstart on this quickly.
To deploy the JMeter container into OpenShift, runs the following.
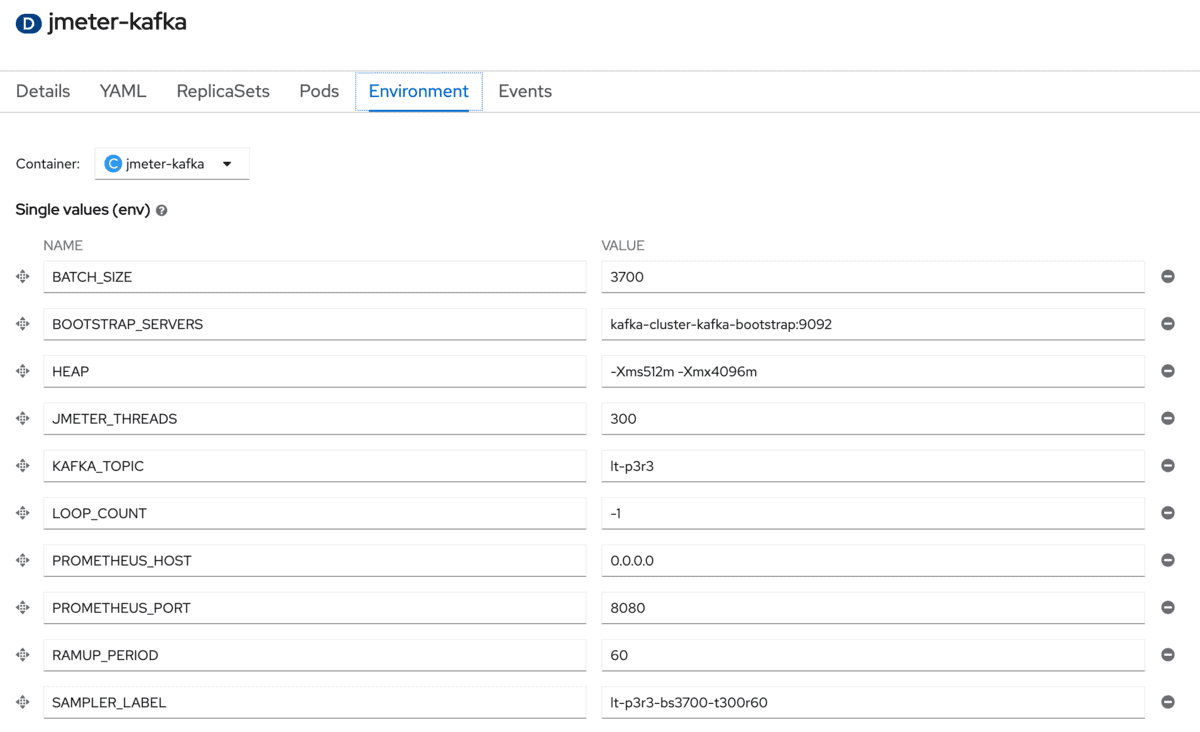
oc new-app --docker-image=docker.io/chengkuan/jmeter-kafka:1.0 --name=jmeter-kafka -e "JMETER_THREADS=300" -e "BOOTSTRAP_SERVERS=kafka-cluster-kafka-bootstrap:9092" -e "PROMETHEUS_PORT=8080" -e "PROMETHEUS_HOST=0.0.0.0" -e "SAMPLER_LABEL=lt-p3r3-bs3700-t300r60" -e "BATCH_SIZE=3700" -e "HEAP=-Xms512m -Xmx4096m" -e "RAMUP_PERIOD=60" -e "LOOP_COUNT=-1" -e "KAFKA_TOPIC=lt-p3r3" -l app=jmeter -n kafka-jmeterNote that in the above example, the JMeter Exporter for Prometheus is configured to listen to all address (0.0.0.0) and port 8080. I behaved lazy here by reusing the default service port created by the oc new-app command. You can change this to suit your need.
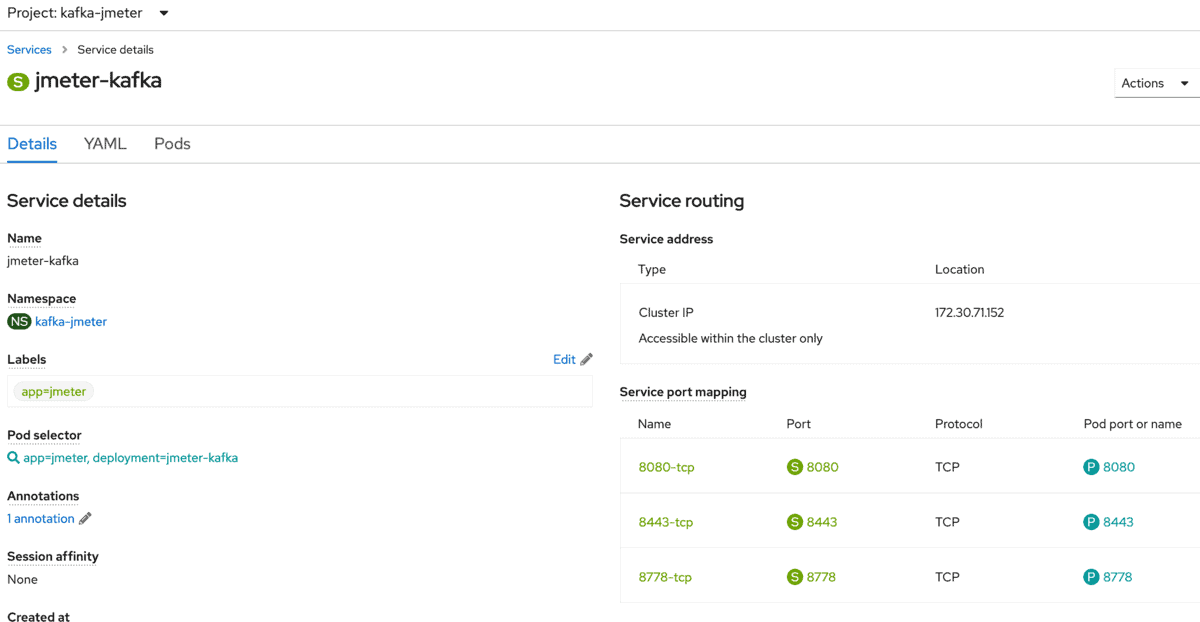
The LOOP_COUNT is configured to -1 so that I can continue to run this until I am satisfied with the metrics collected.
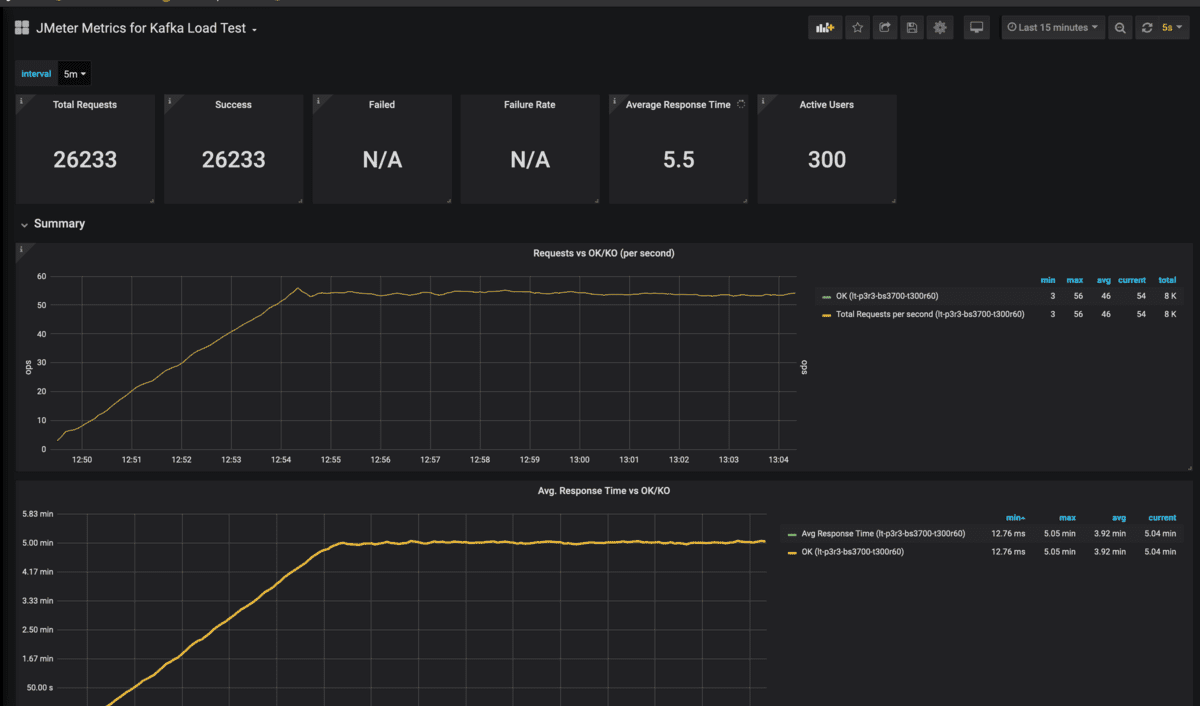
I also use SAMPLER_LABEL to label my load test. I can use this to label different load test scenarios and this has become very convenient when you are monitoring the metrics from Grafana dashboards, which allows you to compare the test result for different scenarios.
Running on OpenShift make things a whole lot easier. For example, I can increase the load test by just increase the number of POD.
If all works as expected, you should be able to see the following screens as a result.

With the Grafana running, import the following sample dashboards for JMeter and Kafka. Please refers to the GitHub List of Files section for more detail.
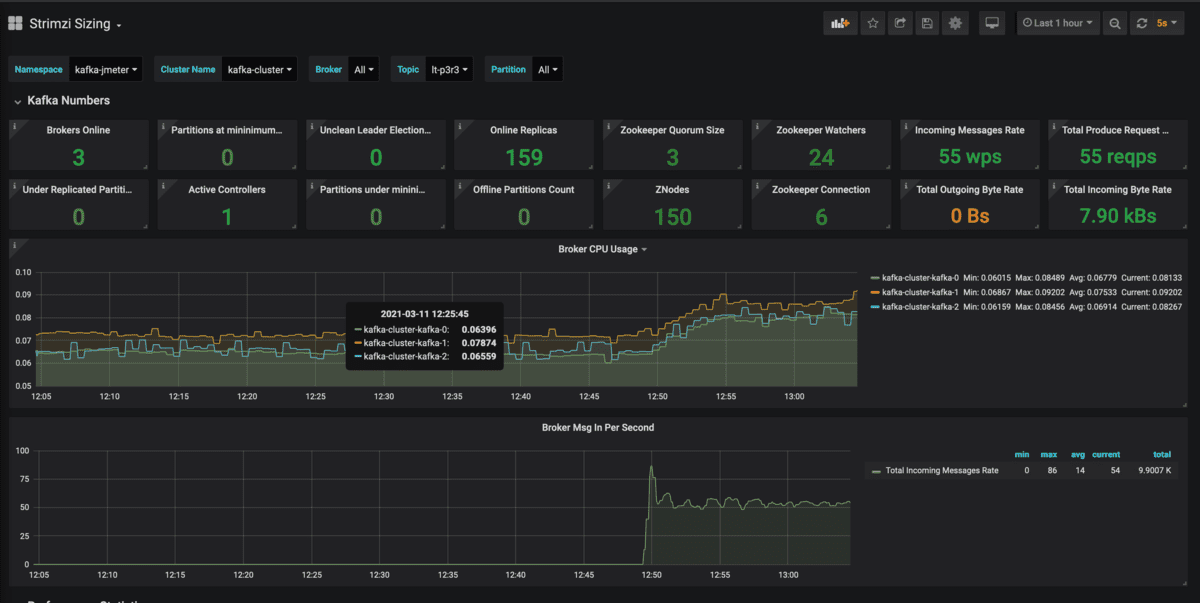
Once you have done the test, the quick way to stop the JMeter container is to delete the OpenShift Deployment, or simply just run the following command to delete all the JMeter container related components.
oc delete all -l app-jmeterWatch the Demo on Youtube
Summary
I hope this article provides you a good start for Kafka load testing on container platform.
There also some drawbacks of using JMeter as container such as it is heavy load because of Java and running huge Java threads(JMeter Threads) on a single container is not recommended. However, with some brilliant approach you can compensate that, for an instance, I can easily scale the number of POD on OpenShift to simulate more user loads instead of cramping all the threads into one single POD.
Let me know if this helps you and any feedback is most welcome.
Please note I had recently updated the container by removing the Prometheus listener. From what I learned JMeter listener causes performance issue, which it did to the container. Once I removed it, the performance become way much better. Take a look at the GitHub update.
References
- This project on GitHub
- Kafka JMX Exporter for Prometheus
- JMeter Prometheus Plugin

