Table of Contents
- Overview
- Configure Nginx Ingress Controller Custom Log Format
- Configure Kibana for Nginx Custom Log Format
- Deploy Fluent Bit on Kubernetes
- Performing Quick Log Analytics
- Summary
Overview
In the previous post, I covers the high level concept of FluentD, ElasticSearch and Kibana, and how to quickly deploy ElasticSearch and Kibana using Docker Compose on Raspberry Pi 4. In this post, we are going to look at how to deploy and configure Fluent Bit (a sub-project of FluentD) to capture the Nginx Ingress Controller logs on Kubernetes and stream the formatted logs to ElasticSearch. We can then perform the logs analytics using Kibana.
By the way, do I need to mention my Kubernetes cluster is running on RPI4! If you miss those details, you can find out more from my previous posts on how to install and configure Kubernetes on RPI4.
One of my objectives to analyse the logs is to understand braindose.blog web traffics and to be able to capture the real visitors IPs for further analytics and threats prevention.
For my Kubernetes cluster environment, I have configured HAProxy in front of the Nginx Ingress Controller. With SSL pass-through configured at the HAProxy, I am not able to capture the real IP address from the encrypted traffics. Reconfigure to use SSL termination at HAProxy is not an option for me and I do not wish to go through the nightmare to change things that have been working fine at the moment. Do not fix if not broken!
So the only possible solution is to capture and analyze the Nginx Ingress Controller logs.
Configure Nginx Ingress Controller Custom Log Format
Since I need to capture the real visitors IP addresses, I need to be able to capture the X-Forwarded-For HTTP header in the Nginx Ingress Controller log. To do this, I need to change the configuration in the Nginx Ingress Controller configmap.
This is done by first issuing the following command to edit the configmap.
kubectl edit cm ingress-nginx-controller -n ingress-nginxWe proceed to modify the configmap to include the following Nginx configuration under the data stanza.
Note that the custom log format is almost the same as the default log format except that we need to add $http_x_forwarded_for field to insert the X-Forwarded-For HTTP header into the log entries. This will give us the actual visitors IP address. In the following example, we insert this as the first field in the log entries.
The settings in the example below are derived from Nginx Module called ngx_http_realip_module. Please do not forget to enter the actual IP for your web proxy at the set-real-ip-from variable. In this case it is my HAProxy IP address.
data:
    # omitted lines before ...

    log-format-upstream: $http_x_forwarded_for $remote_addr - $remote_user [$time_local]
        "$request" $status $body_bytes_sent "$http_referer" "$http_user_agent" $request_length
        $request_time [$proxy_upstream_name] [$proxy_alternative_upstream_name] $upstream_addr
        $upstream_response_length $upstream_response_time $upstream_status $req_id
    proxy-protocol: "True"
    real-ip-header: proxy_protocol
    set-real-ip-from: <haproxy-ip-address>

    # omitted lines after ...
The following shows the example of the custom log format based on the above configuration. 70.50.160.124 is the real visitor IP address.
70.50.160.124 10.244.7.1 - user [15/Jul/2022:16:44:56 +0000] "GET /ocs/v2.php/apps/user_status/api/v1/user_status?format=json HTTP/2.0" 200 150 "-" "Mozilla/5.0 (Macintosh) mirall/3.5.2git (build 10815) (Nextcloud, osx-21.5.0 ClientArchitecture: arm64 OsArchitecture: arm64)" 409 0.890 [nextcloud-9090] [] 10.244.4.26:80 150 0.888 200 4d389b27-4e6d-4091-849c-f05b14deb1e0Once we have these real IP addresses, we will use them to help us to identify our website visitors locations using Fluent Bit GeoIP2 filter. We will cover more detail on this later.
Configure Kibana for Nginx Custom Log Format
As mentioned, we are going to use Fluent Bit GeoIP2 filter to translate the IP addresses into Geolocation coordinates. Before we proceed to capture and stream the Nginx Ingress Controller log to the ElasticSearch, we need to configure ElasticSearch Index to be able to convert the coordinates (in the form of latitude and longitude in float numbers) into Kibana’s geo_point data format. We can do this via the Field Mapping provided by Index Templates in Kibana.
Let’s proceed to create the Kibana Index Template.
First, logon to your Kibana web console and browse to Stack Management and select Index Management.

Click on the Create Template button.
Enter the Name for the template and the Index patterns. The index patterns must be something that will match your Nginx ElasticSearch indices names. For my environment configuration, the indices created start with nginx*.
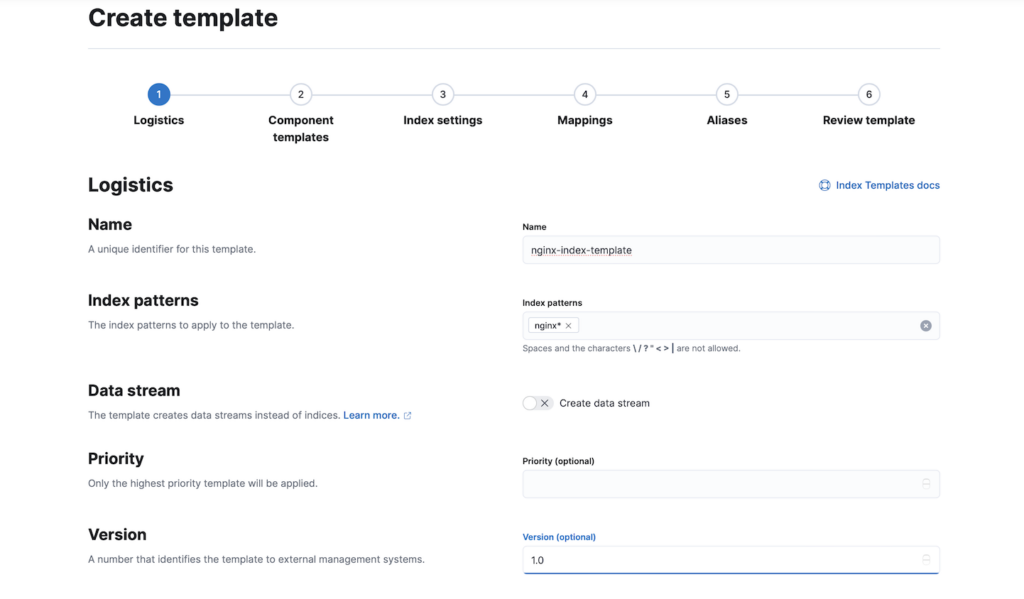
Click Next on the wizard until you reach the Mappings page.
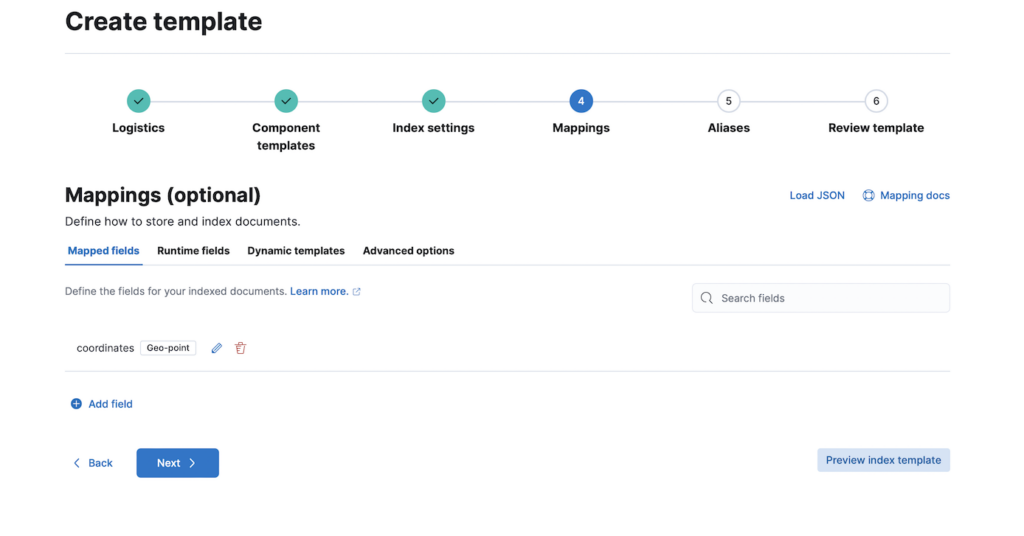
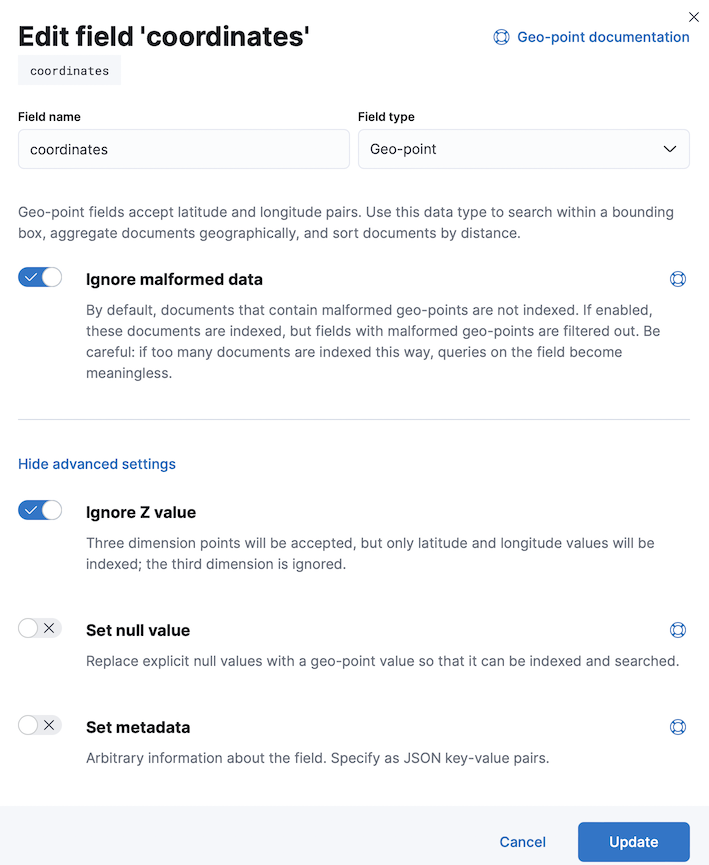
On the Mappings page, we need to create a field mapping to map the coordinates from the log into Geo-point (or geo_point) field type. In this example, we need to use field name same as the log field that we are going to configure later. In this example, we are using coordinates as the field name.
The following show the details on the field mapping configuration.
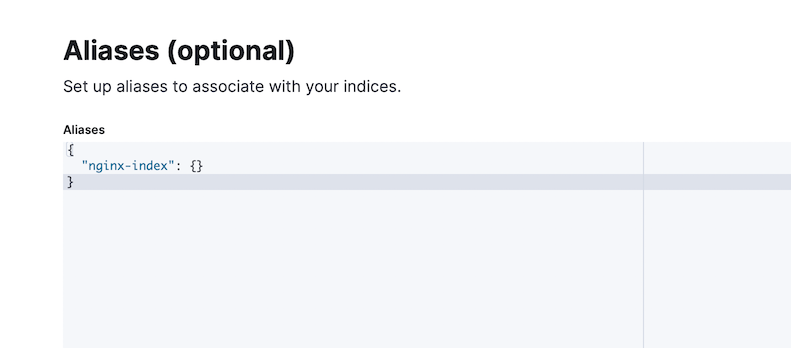
We also need to enter the Index Aliases in the next screen.
Proceed to the next screen to review the changes and click Create templates button to complete it.
This is what you will have on your Index Management screen after a successful Index Template creation.
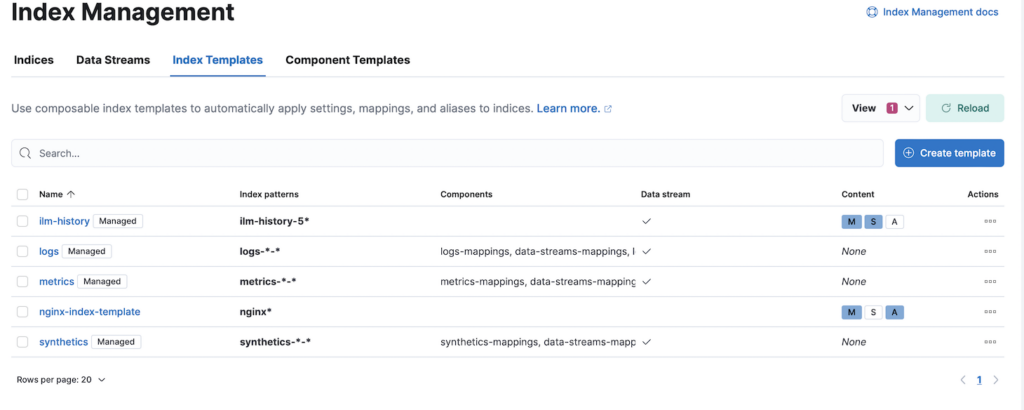
We can now proceed to configure and deploy Fluent Bit onto Kubernetes in the next section.
Deploy Fluent Bit on Kubernetes
In this section, we will perform a number of configurations such as Fluent Bit input, parsers, filters and output plugins. I will skip the explanation of the configuration for Kubernetes namespaces, ServiceAccount and ClusterRole in this post. You can refer to these details in the YAML file.
Fluent Bit Configuration
We need to provide the various Fluent Bit plugins configure as a configmap.
First, we will define the main configuration as per the following. This main configuration includes additional configurations for the input, parsers, filters and outputs.
fluent-bit.conf: |
    [SERVICE]
      Flush         5
      Log_Level     info
      Daemon        off
      Parsers_File  parsers.conf
      HTTP_Server   off
      HTTP_Listen   0.0.0.0
      HTTP_Port     2020

    @INCLUDE input-kubernetes.conf
    @INCLUDE filter-kubernetes.conf
    @INCLUDE filter-geoip2.conf
    @INCLUDE filter-nest.conf
    @INCLUDE filter-record-modifier.conf
    @INCLUDE output-elasticsearch.conf
    #@INCLUDE output-stdout.conf         # uncomment this to view output in stdout & comment out output for es
In the above, the parsers are configured in the file named parsers.conf via the property named Parsers_File.
  parsers.conf: |

    [PARSER]
      # https://rubular.com/r/V3W1DWyv5uFCfh
      Name        k8s-nginx-ingress
      Format      regex
      Regex       ^(?<real_client_ip>[^ ]*) (?<host>[^ ]*) - (?<user>[^ ]*) \[(?<time>[^\]]*)\] "(?<method>\S+)(?: +(?<path>[^\"]*?)(?: +\S*)?)?" (?<code>[^ ]*) (?<size>[^ ]*) "(?<referer>[^\"]*)" "(?<agent>[^\"]*)" (?<request_length>[^ ]*) (?<request_time>[^ ]*) \[(?<proxy_upstream_name>[^ ]*)\] (\[(?<proxy_alternative_upstream_name>[^ ]*)\] )?(?<upstream_addr>[^ ]*) (?<upstream_response_length>[^ ]*) (?<upstream_response_time>[^ ]*) (?<upstream_status>[^ ]*) (?<reg_id>[^ ]*).*$
      #Regex       ^(?<host>[^ ]*) - (?<user>[^ ]*) \[(?<time>[^\]]*)\] "(?<method>\S+)(?: +(?<path>[^\"]*?)(?: +\S*)?)?" (?<code>[^ ]*) (?<size>[^ ]*) "(?<referer>[^\"]*)" "(?<agent>[^\"]*)" (?<request_length>[^ ]*) (?<request_time>[^ ]*) \[(?<proxy_upstream_name>[^ ]*)\] (\[(?<proxy_alternative_upstream_name>[^ ]*)\] )?(?<upstream_addr>[^ ]*) (?<upstream_response_length>[^ ]*) (?<upstream_response_time>[^ ]*) (?<upstream_status>[^ ]*) (?<reg_id>[^ ]*).*$
      Time_Key    time
      Time_Format %d/%b/%Y:%H:%M:%S %z

    [PARSER]
      # http://rubular.com/r/tjUt3Awgg4
      Name        cri
      Format      regex
      # XXX: modified from upstream: s/message/log/
      Regex       ^(?<time>[^ ]+) (?<stream>stdout|stderr) (?<logtag>[^ ]*) (?<log>.*)$
      Time_Key    time
      Time_Format %Y-%m-%dT%H:%M:%S.%L%z

    [PARSER]
      Name    catchall
      Format  regex
      Regex   ^(?<message>.*)$
The parsers.conf is configured with the following plugins definitions.
- k8s-nginx-ingress – Implemented as regex plugin to parse the custom Nginx Ingress Controller log. This parser is called by Pods that are annotated with “fluentbit.io/parser”: “k8s-nginx-ingress”
- cri – Implemented as regex plugin to parse ContainerD log format. In this case, my Kubernetes cluster is using ContainerD container engine.
- catchall – A specific regex implementation to process Kubernetes logs and Nginx logs. We need to provide a simple tweak using this parser at the Kubernetes filter to make sure logs from Kubernetes and Nginx can be parsed into combined log entry. A reported issue and solution is described in the GitHub here.
The following define Fluent Bit input using tail plugin. In here we are using cri parser we defined previously to properly parse the Nginx Ingress Controller log defined by the Path variable.
input-kubernetes.conf: |
    [INPUT]
      Name              tail
      Tag               nginx.*
      Path              /var/log/containers/ingress-nginx-controller*.log
      Parser            cri
      DB                /var/log/flb_kube.db
      Mem_Buf_Limit     5MB
      Skip_Long_Lines   On
      Refresh_Interval  10
The following is the definition of Kubernetes filter. We need to define this filter so that we are able to parse the Nginx log using the k8s-nginx-ingress parser that we defined earlier. Using this filter, we can also capture the information of the PODs and relevant labels and metadata. More details will be revealed at later part.
filter-kubernetes.conf: |
    [FILTER]
      Name                kubernetes
      Match               nginx.*
      Kube_URL            https://kubernetes.default.svc:443
      Kube_CA_File        /var/run/secrets/kubernetes.io/serviceaccount/ca.crt
      Kube_Token_File     /var/run/secrets/kubernetes.io/serviceaccount/token
      Kube_Tag_Prefix     kube.var.log.containers.
      Merge_Log           On
      K8S-Logging.Parser  On
      K8S-Logging.Exclude On
      Merge_Parser        catchall
      Keep_Log            Off
      Labels              Off   # I purposely turn off this because I do not need it
      Annotations         Off   # I purposely turn off this because I do not need it
The following is the GeoIP2 filter that will help us to map IP address to country, city and latitude & longitude.
filter-geoip2.conf: |
    [FILTER]
      Name geoip2
      Match nginx.*
      Database ${GEOIP2_DB}  # Defined as environmental variable in DaemonSet
      Lookup_key real_client_ip
      Record country_name real_client_ip %{country.names.en}
      Record country_code real_client_ip %{country.iso_code}
      Record city real_client_ip %{city.names.en}
      Record coord.lat real_client_ip %{location.latitude}
      Record coord.lon real_client_ip %{location.longitude}
In order to create the data structure that can be converted into Kibana geo_point data type using the Kibana Index Template that we created earlier, we need to convert the latitude and longitude under a field named coordinates. This is done by nesting these fields under the coordinates field. This is achieved using the Nest filter at the following.
filter-nest.conf: |
    [FILTER]
      Name nest
      Match nginx.*
      Operation nest
      Wildcard coord.*
      Nest_under coordinates
      Remove_prefix coord.
The converted Fluent Bit JSON log format will look similar to the following. Note that it is mandatory to use the name of lat and lon (default names required by the field mapping) . These are defined in filter-geoip2.conf as coord.lat and coord.lon. We removed the prefix coord using the Remove_prefix.
"coordinates"=>{"lat"=>2.993500, "lon"=>101.745000}Note: I have tried to use Kibana Runtime Field to transform the lat and lon fields to geo_point but it seems not supported by Kibana Maps. Here is my reported issue in the Kibana Github.
In order to reduce the log size sent over to the ElasticSearch, I decided to remove all non-necessary details from the log. I am using record_modifier filter at the following to remove Kubernetes field, stream field, logtag field and reg_id field which they are non-essential for my log analytics.
filter-record-modifier.conf: |
    [FILTER]
      Name record_modifier
      Match nginx.*
      Remove_key kubernetes
      Remove_key stream
      Remove_key logtag
      Remove_key reg_id
Finally I defined 2 output plugins here.
output-elasticsearch.conf defines ElasticSearch output plugin where and how to send the log. ${ELASTICSEARCH_HOST} and ${ELASTICSEARCH_POST} is the environmental variables defined in DeamonSet configuration which we will cover later.
output-stdout.conf is used when I need to troubleshoot or test the configurations. I can comment and uncomment this in the fluent-bit.conf.
Note that we need to configure Suppress_Type_Name to overcome the error that we will encounter with ElasticSeach v8.
  output-stdout.conf: |
    [OUTPUT]
      name  stdout
      match *

  output-elasticsearch.conf: |
    [OUTPUT]
      Name            es
      Match           nginx.*
      Host            ${ELASTICSEARCH_HOST}
      Port            ${ELASTICSEARCH_PORT}
      Logstash_Prefix nginx-k8s
      Logstash_Format On
      Replace_Dots    On
      Retry_Limit     False
      tls.verify      off        # turn off tls verification for self-signed cert
      tls             on
      HTTP_User       elastic
      HTTP_Passwd     <password>
      Trace_Error     On
      Trace_Output    Off
      Suppress_Type_Name  On
Note: You should use Kubernetes secret for the HTTP_Passwd in the above configuration. You can pass the secret as environmental variable in the Kubernetes yaml config.
Warning: elastic is a superuser and should not be used for Kibana and ElasticSearch integration. There are number of built-in Kibana roles that you can used to create an user for this integration purpose.
You may notice we never define how to invoke the k8s-nginx-ingress parser. This is where we need to annotate the Nginx Ingress Controller PODs. Instead of doing this at the POD level, we define this annotation at the Kubernetes Deployment CRD. We can do this by the following command.
The annotation specifically instruct the Fluent Bit Kubernetes Filter to use the k8s-nginx-ingress parser for Nginx Ingress Controller Pods.
kubectl patch deployment ingress-nginx-controller -n ingress-nginx --patch '{"spec": { "template": { "metadata": {"annotations": {"fluentbit.io/parser": "k8s-nginx-ingress" }}}}}' -n ingress-nginxDeploying Fluent Bit to Kubernetes
In this section, we are looking at how to deploy Fluent Bit as a DaemonSet into Kubernetes. DaemonSet ensures that the Fluent Bit POD will be deployed into each node in your Kubernetes cluster.
I have designated “infra” nodes for Nginx Ingress Controller and because I only need to capture Nginx log for now and for that I just need to deploy Fluent Bit Pods into my “infra” nodes.
In fact I do not need to use DaemonSet and I can just deploy Fluent Bit as standard POD deployment and apply nodeAffinity to ensure the Fluent Bit PODs only deployed to “infra” nodes.
However let’s just stick to DaemonSet for now. I believe using DaemonSet is future proof if I need to capture additional logs other than Nginx later.
Let’s look at some of the YAML configuration details.
The following are some of the environmental variables and volumes that we need to configure for Fluent Bit.
        env:
        - name: ELASTICSEARCH_HOST
          value: "elasticsearch.internal"
        - name: ELASTICSEARCH_PORT
          value: "9200"
        - name: GEOIP2_DB
          value: "/geoip2-db/GeoLite2-City.mmdb"
        volumeMounts:
        - name: varlog
          mountPath: /var/log
        - name: varlibdockercontainers
          mountPath: /var/lib/docker/containers
          readOnly: true
        - name: geoip2-db
          mountPath: /geoip2-db
          readOnly: true
        - name: fluent-bit-config
          mountPath: /fluent-bit/etc/
From the above, you may notice we need to configure the location of the GeoIP2 database file via the GEOIP2_DB variable. This is the free version of GeoIP2 database file that you can download from MaxMind official website. I am using persistence volume (PV) here so that I only need to copy this file once into the PV.
I will only be able to copy the database file after the PV is created during Pod initialization. So please be expecting a short moment of Pod initiation failure until the file is copied into the PV.
As mentioned earlier, I want to deploy the DaemonSet into the designated “infra” nodes. So the following nodeAffinity definition does the trick.
      tolerations:
      - key: type
        operator: Equal
        value: infra
        effect: NoSchedule
      affinity:
        nodeAffinity:
          requiredDuringSchedulingIgnoredDuringExecution:
            nodeSelectorTerms:
            - matchExpressions:
              - key: node/type
                operator: In
                values:
                - infra
You can refer to the complete YAML file at the GitHub here.
Let’s proceed to deploy the Fluent Bit using the following command
kuberctl apply -f nginx-fluent-bit.yamlThe following is the sample output at the console when stdout output is used to verify the logs are captured and parsed as per our expectation.
[0] nginx.var.log.containers.ingress-nginx-controller-774657884f-zd9kp_ingress-nginx_controller-c245264bb26545c58a93df547373156c65d8e0ce792e5b359413556956e746c8.log: [1657969851.000000000, {"real_client_ip"=>"60.45.151.147", "host"=>"10.244.6.1", "user"=>"-", "method"=>"POST", "path"=>"/admin/admin-ajax.php", "code"=>"200", "size"=>"47", "referer"=>"https://braindose.blog/admin/network/plugins.php?plugin_status=inactive", "agent"=>"Mozilla/xxx (Macintosh; Intel Mac OS X) AppleWebKit/xxx (KHTML, like Gecko) Version/xxx Safari/xxx", "request_length"=>"1307", "request_time"=>"1.158", "proxy_upstream_name"=>"wordpress-9081", "upstream_addr"=>"10.244.5.16:80", "upstream_response_length"=>"47", "upstream_response_time"=>"1.164", "upstream_status"=>"200", "reg_id"=>"6df3629d2c607b43eb4f5fd26d27f243", "country_name"=>"Malaysia", "country_code"=>"MY", "city"=>"Somewhere in MY", "coordinates"=>{"lat"=>2.983400, "lon"=>101.785400}}]Performing Quick Log Analytics
Once you have the Fluent Bit collecting the logs into ElasticSearch you can proceed to view and analyze the log in the Kibana.
First, let’s create a data view for the Nginx indices that are created by Fluent Bit output plugin. The example below shows multiple indices already present over a few days for my environment.

The following shows the logs view in the Kibana Discover page
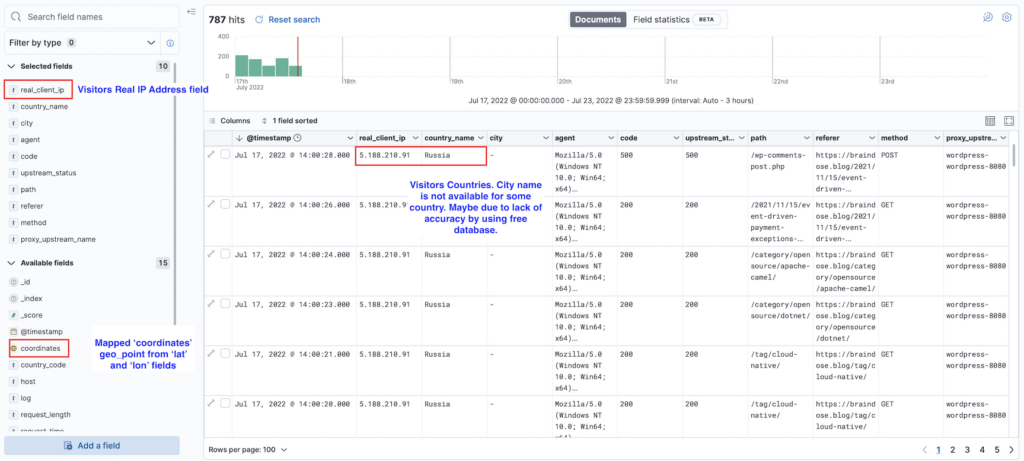
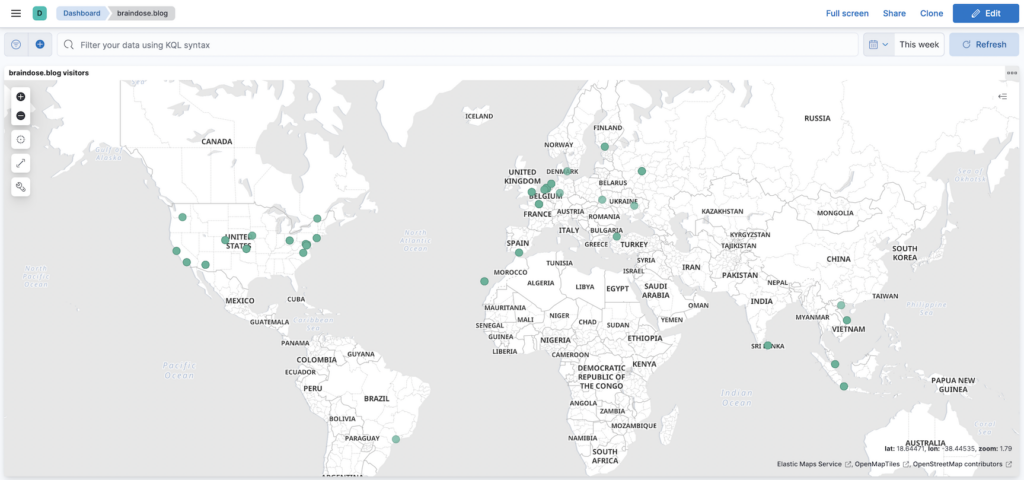
This is the Map view for the all visitors from all over the world to my braindose.blog over 2.5 days.
Summary
We have gone though how to quickly deploy ElasticSearch and Kibana using Docker Compose in previous post. We also going through the details of how to configure and deploy Fluent Bit on Kubernetes to capture and analyse the Nginx Ingress Controller logs in this post. I only cover a small portion of what Elastic Stack can do here and there are many other Elastic Stack’s capabilities yet to explore. However, I hope this post provides a good start for your log analytics journey using Elastic Stack.

