Table of Contents
Overview
If you have followed my posts, you must know I have Kubernetes running on the RPI4 for a while now. There are number of things that I have done on the cluster. The recent enhancement that I have done is to make sure that I can monitor the containers / PODs logs. The solution that I am implementing at is the EFK stack which stands for ElasticSearch, FluentD and Kibana.
FluentD
FluentD is the popular software agent installed at source servers where you wish to collect the logs from. These logs can be application logs, OS logs such as systemd and etc. There are many plugins that you can use to input (or read) the logs, filter and parse (or process) the logs before output (or send) the logs to different destinations. The diversity and complexity of logs can be very hard to process and the FluentD plugins have made the situation easier.
For Kubernetes environment, we should use Fluent Bit which is a sub-project of FluentD for many benefits such as it is more light weight compared to FluentD. You can find out more about the comparison here.
ElasticSearch and Kibana
ElasticSearch is a database with search engine capabilities that allow you to keep large amount of JSON formatted data in the database and being able to search the content inside the database. Kibana provides the dashboard and web console to allows you to do many things such as managing the ElasticSearch indices, performing log analytics and etc. As part of the Elastic Stack, ElasticSearch and Kibana provide a flexible and features rich solution for logs analytics. They are easy to learn if you wish to get started quickly on log analytics.
In this post, I am focusing on deploying and configuring ElasticSearch and Kibana using Docker container. I find container deployment is always the easiest way to get started and the official container images do support arm64 which is perfect for RPI4.
Deploying ElasticSearch
The ElasticSearch container image can be downloaded from the Docker Hub. We are going to use Docker compose to deploy both ElasticSearch and Kibana.
In order to integrate Kibana and ElasticSearch, we need to have the enrolment token from ElasticSearch. The official ElasticSearch document states the ElasticSearch superuser (which the username is elastic) password and Kibana enrolment token will be printed on the Docker stdout console during initial startup but this is not what is happening.
So I have to first deploy the ElasticSearch to be able to reset the elastic user password and then using the password to generate the enrolment token for Kibana.
The following Docker compose file deploy a standalone ElasticSearch. If you wish to deploy multi-nodes cluster, you can refer to the official document.
version: '2.2'
    services:
        es01:
            image: elasticsearch:8.3.2
            container_name: elasticsearch
            environment:
                - node.name=es01
                - discovery.type=single-node
                - bootstrap.memory_lock=true
                - "ES_JAVA_OPTS=-Xms512m -Xmx1024m"
            ulimits:
                memlock:
                    soft: -1
                    hard: -1
            volumes:
                - es-data:/usr/share/elasticsearch/data
                - es-config:/usr/share/elasticsearch/config
            ports:
                - 9200:9200
            networks:
                - elastic
        volumes:
            es-data:
                driver: local
            es-config:
                driver: local
        networks:
            elastic:
                driver: bridge
Wait for the container to be ready. This can take while since we are using RPI4. We will run the following command to reset the password for elastic user. The password will be printed on the console. Keep it in safe place.
sudo docker exec -it elasticsearch bin/elasticsearch-reset-password -u elasticWe can now test the ElasticSearch with the following curl command. Remember to replace the password and the IP address for ElasticSearch server. By default the server are deployed with self-signed certificate. This is perfectly fine if the server is not exposed to internet but for internal network.
curl --user elastic:<password> -k -H 'Content-Type: application/json' -XGET https://elasticsearch:9200/_cluster/healthIf you receive a response something similar to the following, it means your ElasticSearch is ready to serve.
{"cluster_name":"docker-cluster","status":"yellow","timed_out":false,"number_of_nodes":1,"number_of_data_nodes":1,"active_primary_shards":21,"active_shards":21,"relocating_shards":0,"initializing_shards":0,"unassigned_shards":2,"delayed_unassigned_shards":0,"number_of_pending_tasks":0,"number_of_in_flight_fetch":0,"task_max_waiting_in_queue_millis":0,"active_shards_percent_as_number":91.30434782608695}Next, we will proceed to create a service account token so that we can use this token to configure the ELASTICSEARCH_SERVICEACCOUNTTOKEN for Kibana. This is the token that will be used by Kibana to connect to ElasticSearch. Using serviceaccount token is the recommended approach instead of using username and password.
sudo docker exec -it elasticsearch bin/elasticsearch-service-tokens create elastic/kibana kibana-tokenWe also need to generate an enrolment token which we are going to need this later.
sudo docker exec -it elasticsearch /usr/share/elasticsearch/bin/elasticsearch-create-enrollment-token -s kibanaNow, we can proceed to deploy Kibana in the next section.
Deploying Kibana
Modify the existing Docker compose file to add the following for Kibana. Replace the value for ELASTICSEARCH_SERVICEACCOUNTTOKEN with the token created earlier. Remember to use https instead of http protocol for ELASTICSEARCH_HOSTS.
kibana:
    image: kibana:8.3.2
    container_name: kibana
    environment:
      SERVER_NAME: kibana.internal
      SERVER_PORT: 5601
      ELASTICSEARCH_HOSTS: '["https://es01:9200"]'
      ELASTICSEARCH_SERVICEACCOUNTTOKEN: "<replace-service-account-token>"
      ELASTICSEARCH_SSL_VERIFICATIONMODE: "none"   # Configure this to disable SSL cert verification
    ports:
      - 5601:5601
    volumes:
       - kibana-config:/usr/share/kibana/config
    networks:
      - elastic
Remember to add the volume configuration for Kibana as per the following:
volumes:
  es-data:
    driver: local
  es-config:
    driver: local
  kibana-config:
    driver: local
The complete Docker compose file should look like the following.
version: '2.2'
services:
  es01:
    image: elasticsearch:8.3.2
    container_name: elasticsearch
    environment:
      - node.name=es01
      - discovery.type=single-node
      - bootstrap.memory_lock=true
      - "ES_JAVA_OPTS=-Xms512m -Xmx1024m"
    ulimits:
      memlock:
        soft: -1
        hard: -1
    volumes:
      - es-data:/usr/share/elasticsearch/data
      - es-config:/usr/share/elasticsearch/config
    ports:
      - 9200:9200
    networks:
      - elastic
  kibana:
    image: kibana:8.3.2
    container_name: kibana
    environment:
      SERVER_NAME: kibana.internal
      SERVER_PORT: 5601
      ELASTICSEARCH_HOSTS: '["https://es01:9200"]'
      ELASTICSEARCH_SERVICEACCOUNTTOKEN: "<replace-service-account-token>"
      ELASTICSEARCH_SSL_VERIFICATIONMODE: "none"
    ports:
      - 5601:5601
    volumes:
       - kibana-config:/usr/share/kibana/config
    networks:
      - elastic
volumes:
  es-data:
    driver: local
  es-config:
    driver: local
  kibana-config:
    driver: local
networks:
  elastic:
    driver: bridge
Proceed to start the containers using docker compose command.
Wait for both ElasticSearch and Kibana to get ready. This will take a while for RPI4. You can observe whether the servers are ready by looking at the logs for both servers.
Note: You can also enable healthcheck in the Docker Compose file
When Kibana is ready, we will run the following command to enrol Kibana with ElasticSearch using the enrolment token created earlier.
sudo docker exec -it kibana bin/kibana-setup --enrollment-token <enrollment-token>Restart the Kibana container after the enrolment succeeded.
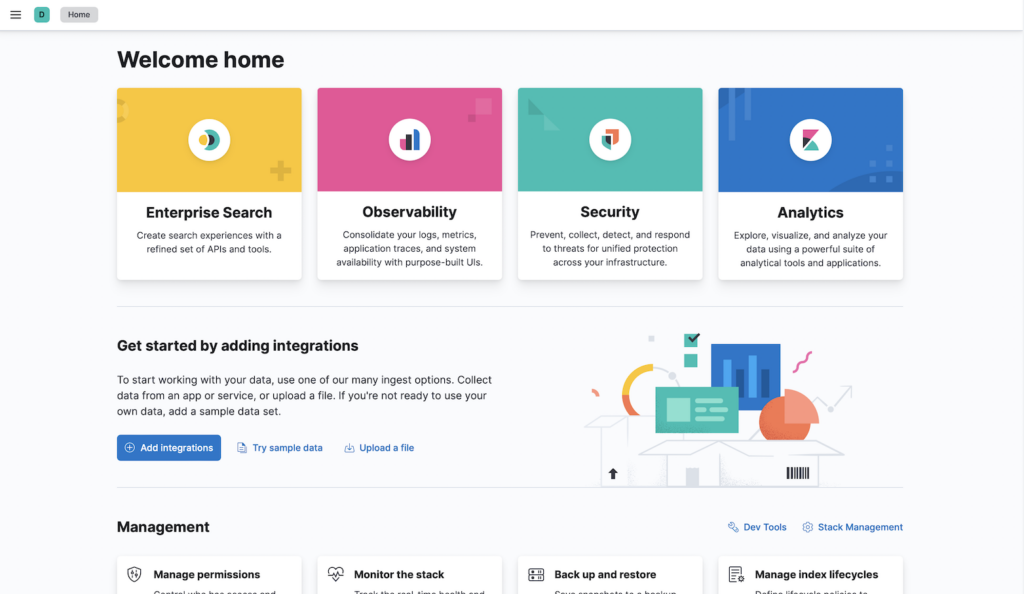
You can now access to your Kibana server at http://<kibana-ip>:5601. You will be prompted to add integration even you have configured the ElasticSearch. This is because you have no data in the ElasticSearch yet.
You will be prompted to create Data View when you have your first Index created in ElasticSearch.

NOTE: elastic is a superuser which should not be used for integration configuration. User with specific permissions should be created for various specific integration scenarios. You can refer to Kibana role management for more detail of how to manage user with different roles.
Summary
In this post we have learned how to quickly deploy a standalone ElasticSearch and Kibana using Docker container. In the next post we will look at how can we configure Fluent Bit to capture logs from Nginx Ingress Controller on Kubernetes platform.

