This article is part of the Payment Gateway use case to illustrate how to implement application resource monitoring using Prometheus on OpenShift.
Table of Contents
- Overview
- Installing Prometheus and Grafana for OpenShift
- Configuring OpenShift Applications to Expose The Metrics
- Configuring Grafana Dashboards
- Summary
- References
Overview
OpenShift Container Platform (OpenShift) includes a pre-configured, pre-installed, and self-updating monitoring stack that is based on the Prometheus open source project and its wider eco-system. It provides monitoring of cluster components and includes a set of alerts to immediately notify the cluster administrator about any occurring problems and a set of Grafana dashboards.
However, the cluster monitoring stack is only supported for monitoring OpenShift Container Platform clusters. As an application team, we can utilise the same Promethues and Grafana technology to provide resource monitoring for our own applications. For this to happen we need to provision our own Prometheus and Grafana.
The bright side is deploying Prometheus and Grafana on OpenShift is pretty easy by using the Prometheus Operator from OpenShift Operator Hub. Bear in mind that Prometheus Operator in current OpenShift is community supported.
In this article, we are going to look at how can we deploy Prometheus and Grafana to enable the resources monitoring for Red Hat AMQ Streams and the other container applications in the Payment Gateway use case. By stating this, we are assuming we have already deployed the Red Hat AMQ Streams and container applications. If not, please refer to the my earlier articles and GitHub on how to deploy them.
Without further ado, let’s look at how to do this on OpenShift.
Installing Prometheus and Grafana for OpenShift
Installing The Prometheus Operator
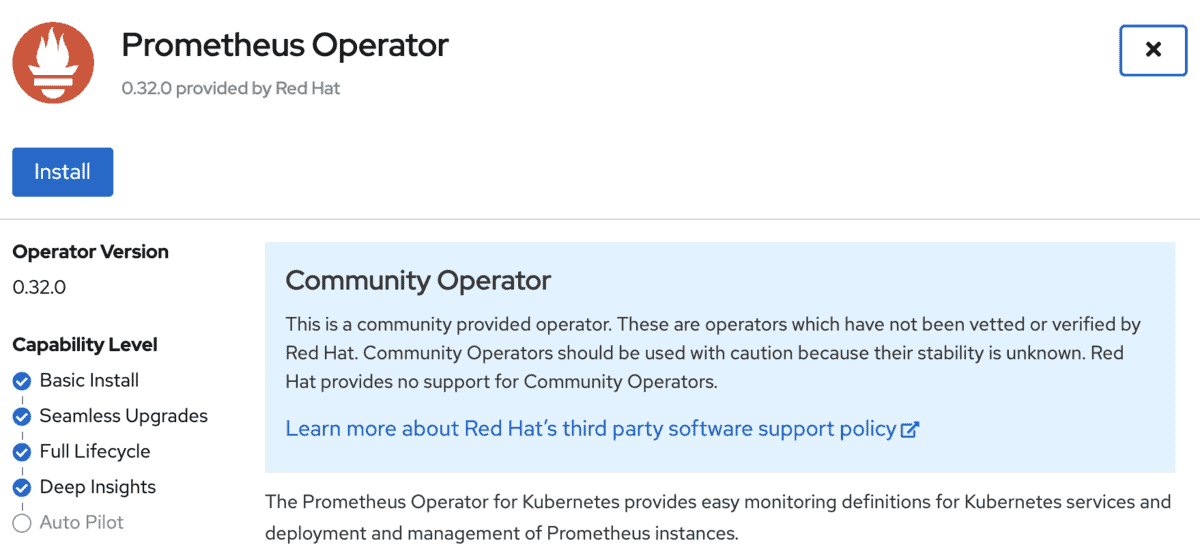
Before installing the Prometheus for your application project in OpenShift, you will need to install the Prometheus Operator. The current community beta release is at version 0.32.0 on OpenShift 4.4. Unlike the OpenShift clustering monitoring operator (the OpenShift monitoring stack) mentioned at the beginning of this article, the current Prometheus Operator community version can only be installed into a specific OpenShift project.
You need user with cluster-admin role to install the operator. Once logon, navigates to the Operator Hub, search for Prometheus Operator and click on the operator to install it. Choose the OpenShift project under the Installed Namespace which you would like to install the operator.
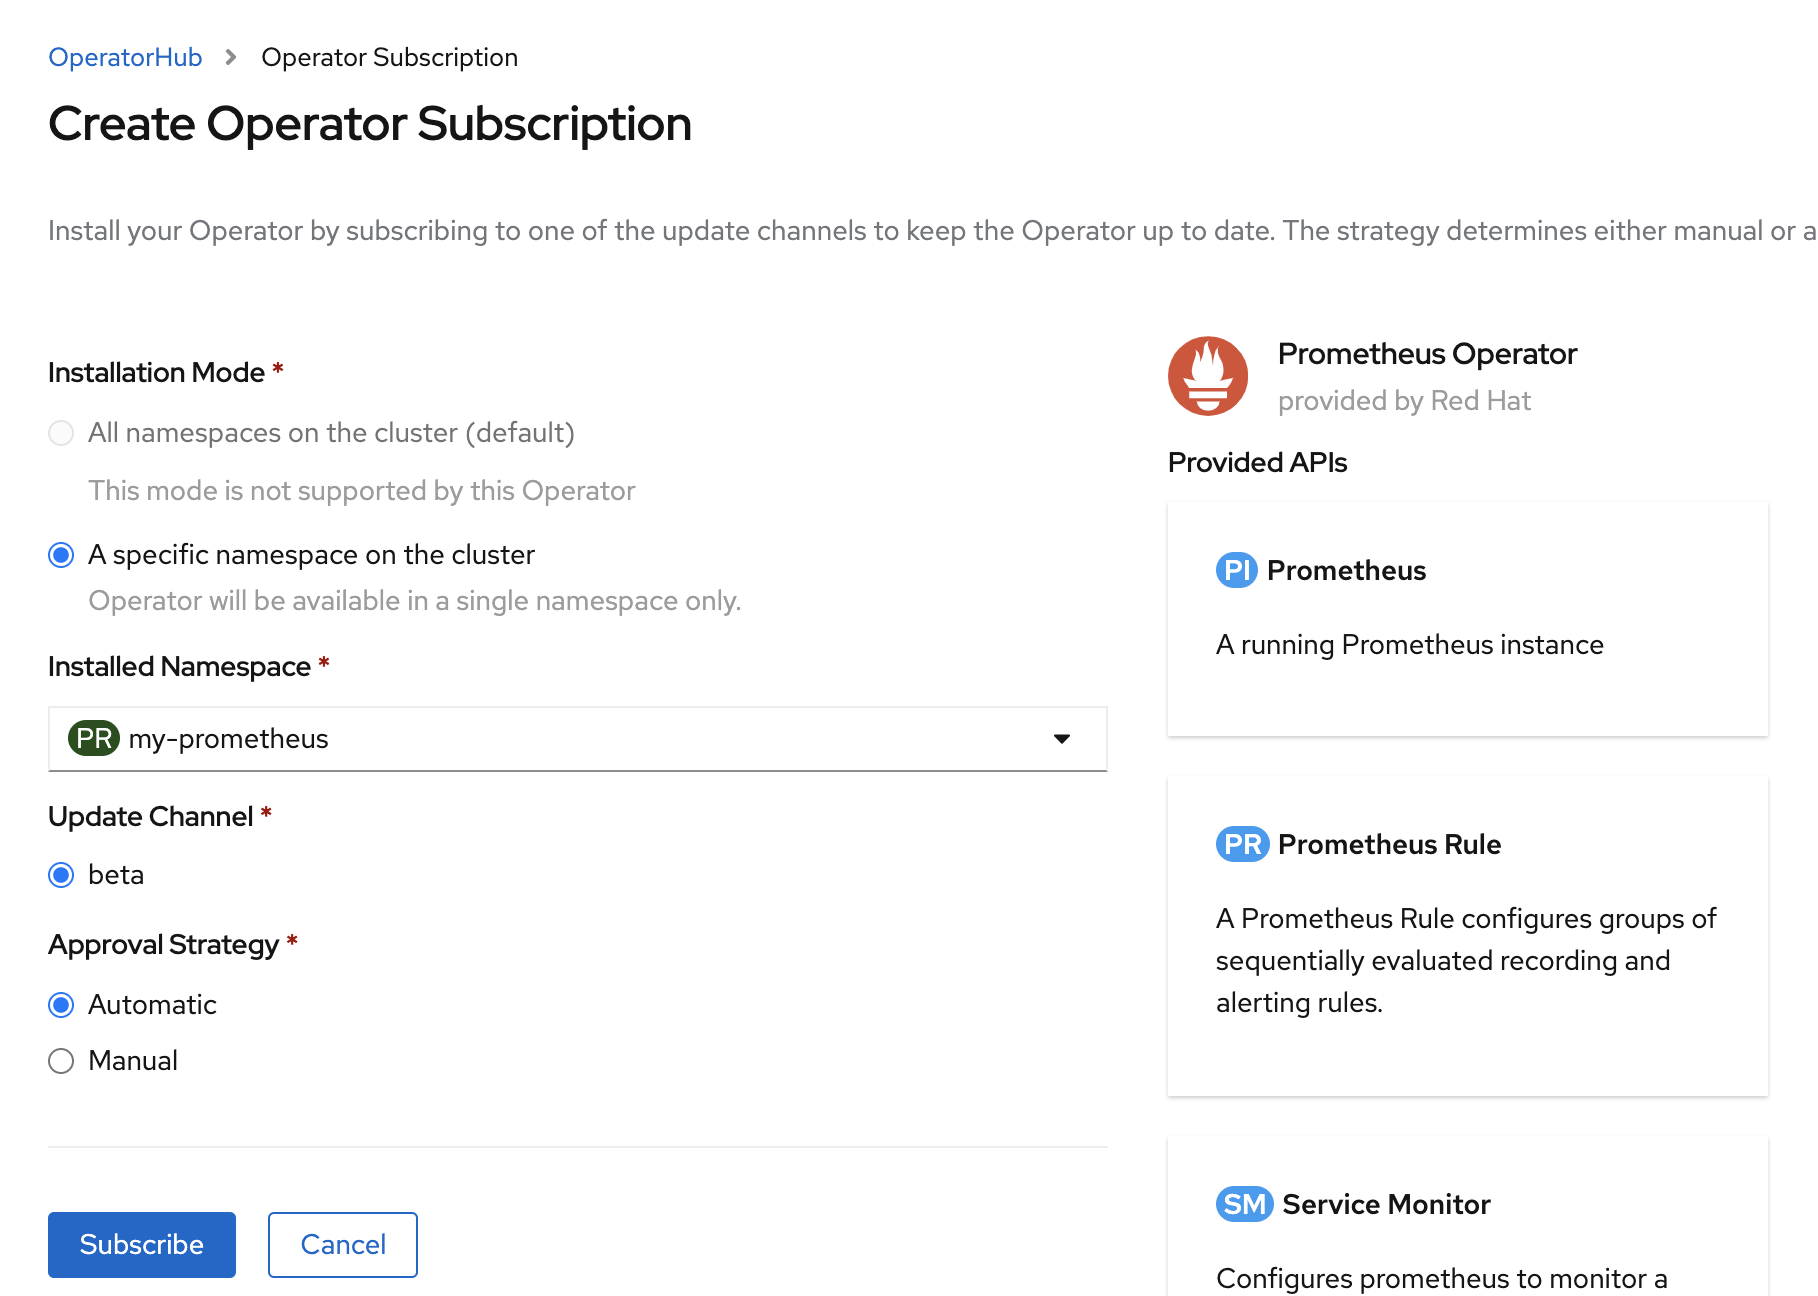
On the above screen, click on Subscribe to install the operator.
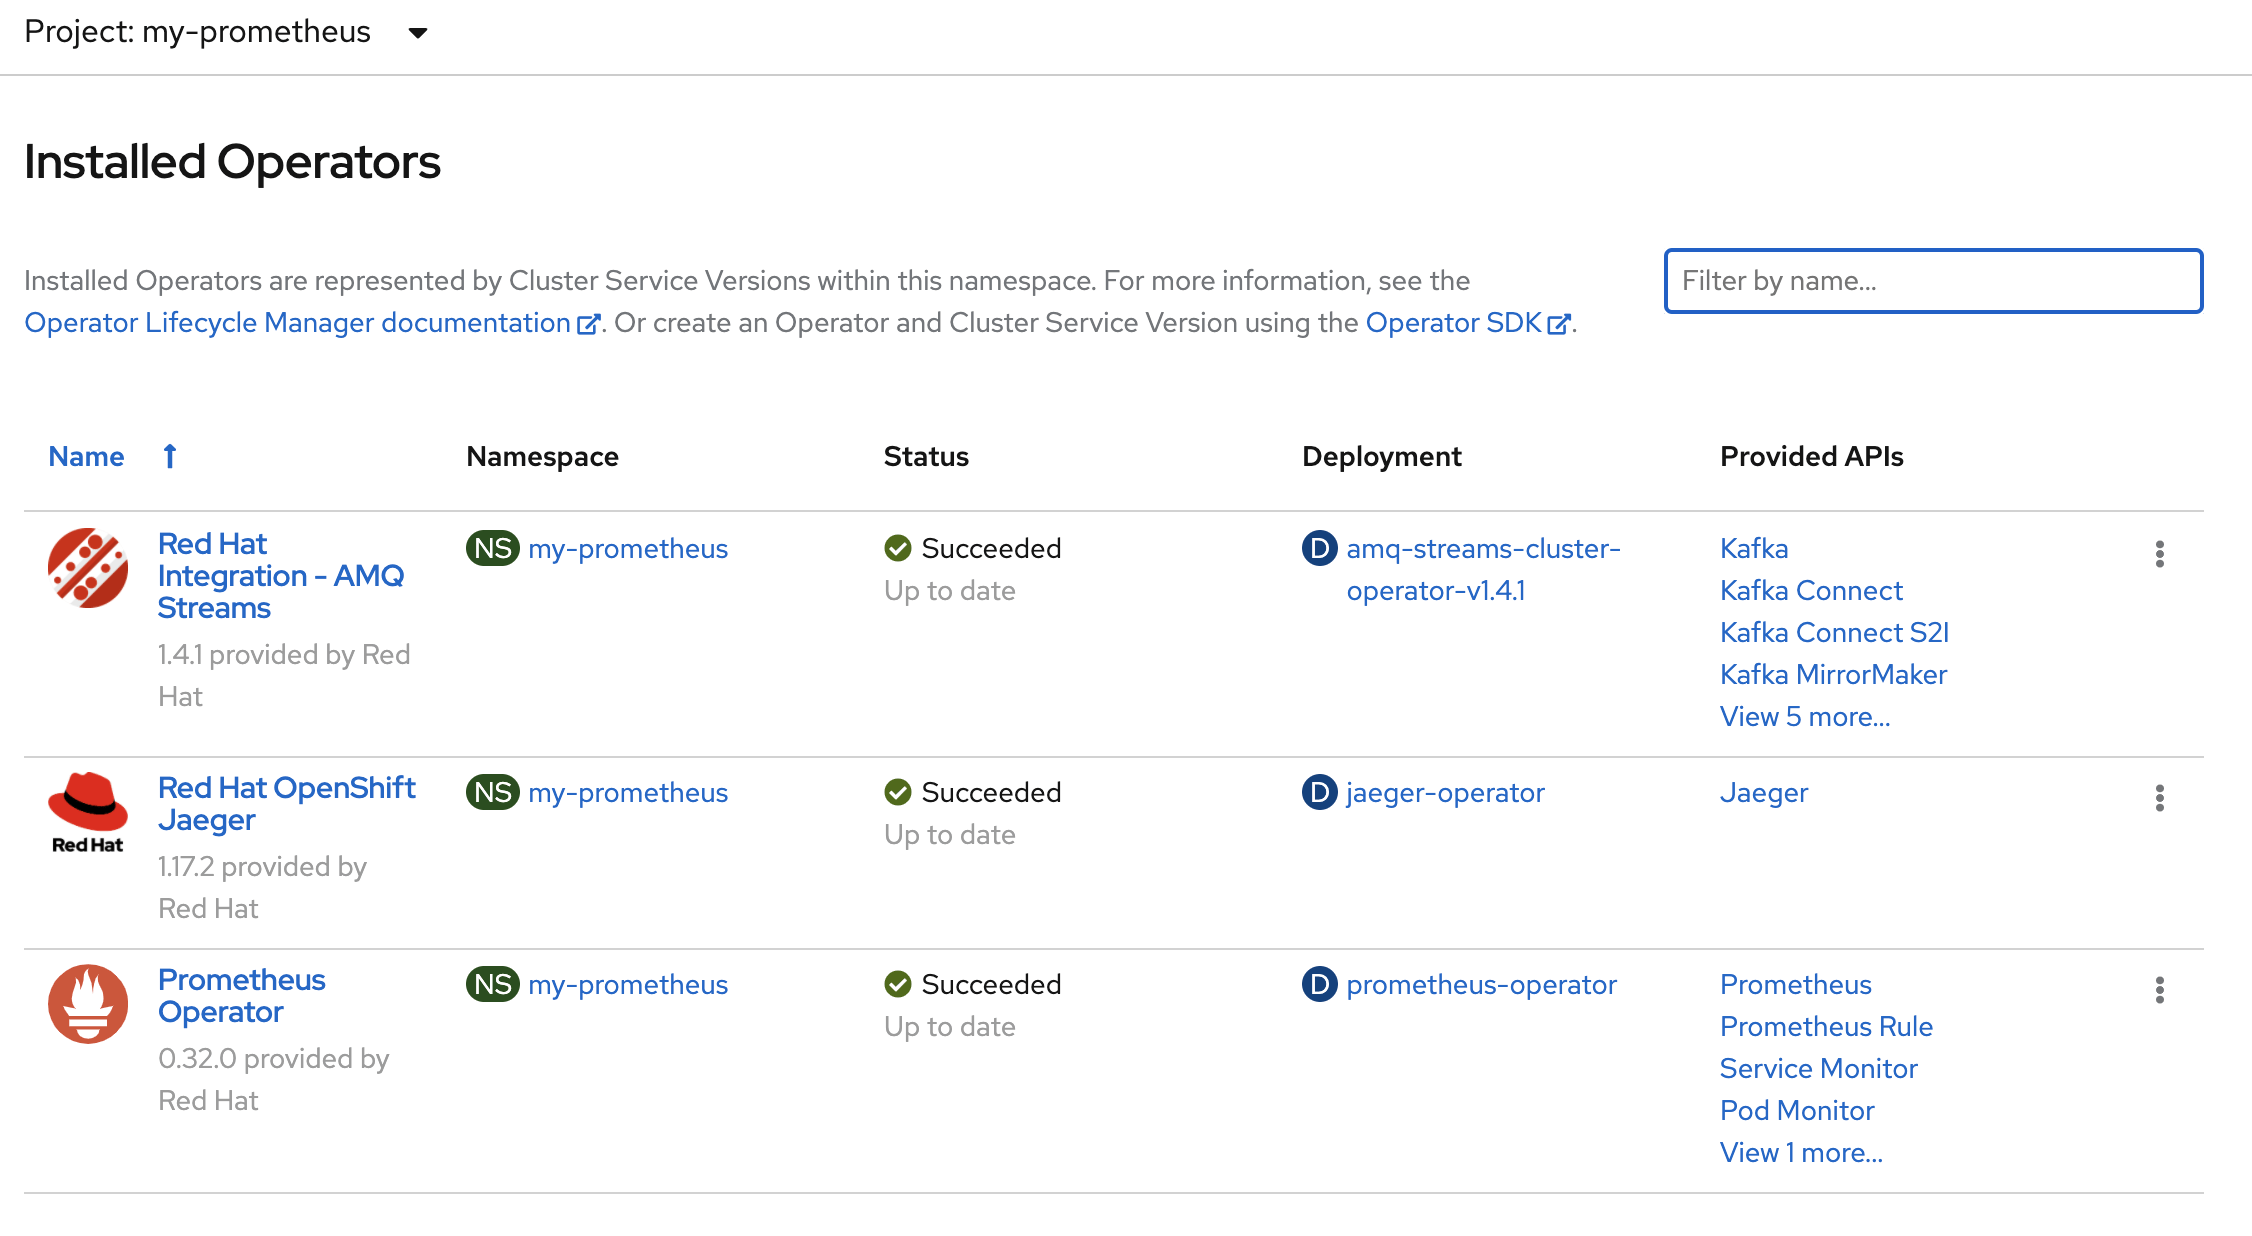
The following shows the OpenShift project with the installed Prometheus Operator. Once the status changed to Succeeded, we can proceed to install the Prometheus container.
In fact, using OpenShift Operator Hub is the most easiest way to deploy Prometheus Operator.
Please note that the paths and configurations information are tailored to Payment Gateway use case in this article. Please amend them according to your environment.
Installing The Prometheus Container
Since this article is part of the Payment Gateway use case, I will be using the yaml files and content that are meant for the use case.
I am using the yaml files from Kafka resources because in the later part of this article I am going to enable the monitoring for Red Hat AMQ Streams (or Kafka).
The first step is to create the secret required for Prometheus. This secret contains some of the Red Hat AMQ Streams metrics configurations for the Prometheus. Replace $APP_NAMESPACE with your actual application namespace. You may refer to the sample prometheus-additional.yaml for more detail.
oc create secret generic additional-scrape-configs --from-file=../templates/kafka/metrics/prometheus-additional-properties/prometheus-additional.yaml -n $APPS_NAMESPACEUpdate the strimzi-service-monitor.yaml file to match your OpenShift project / namespaces. The following is the stanza section that you need to change in strimzi-service-monitor.yaml. Change paygate to the your OpenShift project name.
  namespaceSelector:
    matchNames:
      - paygate
Next, run the following oc command to deploy additional Red Hat AMQ Streams metrics configurations.
oc apply -f ../tmp/kafka/metrics/prometheus-install/strimzi-service-monitor.yaml  -n $APPS_NAMESPACE

oc apply -f ../templates/kafka/metrics/prometheus-install/prometheus-rules.yaml  -n $APPS_NAMESPACE
Note: The Prometheus server is not supported as part of the AMQ Streams distribution. However, the Prometheus endpoint and JMX exporter used to expose the metrics are supported.
Modify the following stanzas in prometheus.yaml file to match your OpenShift project.
subjects:
  - kind: ServiceAccount
    name: prometheus-server
    namespace: paygate
alerting:
alertmanagers:
- namespace: paygate
name: alertmanager
port: alertmanagerRun the following oc command to deploy the Prometheus.
oc apply -f ../tmp/kafka/metrics/prometheus-install/prometheus.yaml -n $APPS_NAMESPACENote: I have provided the same set of yaml files in the GitHub, which have been tailored to deploy the Payment Gateway use case. The same set of original Kafka resource files can be downloaded from Red Hat Access website.
Installing AlertManager
For this example, I am using Slack for the AlertManager, thus I will need to change the following in alert-manager-config.yaml to match the Slack configurations. You should change this to match your Slack configuration for slack_api_url and channel.
global:
  slack_api_url: https://ssa-mr19696.slack.com
route:
  receiver: slack
receivers:
- name: slack
  slack_configs:
  - channel: "#paygate-strimzi"
    title: "{{ range .Alerts }}{{ .Annotations.summary }}\n{{ end }}"
    text: "{{ range .Alerts }}{{ .Annotations.description }}\n{{ end }}"
    send_resolved: true
Run the following oc command to create the secret required for AlertManager using the previous content.
oc create secret generic alertmanager-alertmanager --from-file=alertmanager.yaml=../tmp/kafka/metrics/prometheus-alertmanager-config/alert-manager-config.yaml -n $APPS_NAMESPACERun the following oc command to deploy the AlertManager.
oc apply -f ../templates/kafka/metrics/prometheus-install/alert-manager.yaml -n $APPS_NAMESPACEInstalling Grafana
Installing Grafana is simple, just enter following the command to deploy Grafana onto OpenShift.
oc apply -f ../templates/kafka/metrics/grafana-install/grafana.yaml -n $APPS_NAMESPACEConfiguring OpenShift Applications to Expose The Metrics
By using the Red Hat AMQ Streams metric configuration yaml files, the metrics for Red Hat AMQ Streams metrics are enabled and exposed once the oc commands mentioned in the previous section completed.
In order to expose the NodeJs and SpringBoot applications in the Payment Gateway, we need to configure the following annotations for the respective NodeJs and SpringBoot services.
I am using the Prometheus NodeJs client as per recommended by Prometheus documentation. Using the NodeJs client, the NodeJs container application metrics is exposed at /metrics by default. So we will run the following command to annotate the service to tell Prometheus to scrape the metrics from the Payment Gateway NodeJs container applications at port 8080.
oc annotate svc creditservice prometheus.io/scrape='true' prometheus.io/port='8080' -n $APPS_NAMESPACE

oc annotate svc customer-ui prometheus.io/scrape='true' prometheus.io/port='8080' -n $APPS_NAMESPACE
I am using Micrometer to enable the metrics for SpringBoot container applications. The default metrics for Prometheus is exposed at /actuator/prometheus, thus we need to annotate the respective SpringBoot OpenShift service to tell Prometheus to scrape the metrics with the following specifications.
oc annotate --overwrite svc accountservice prometheus.io/scrape='true' prometheus.io/port='8080' prometheus.io/path=/actuator/prometheus -n $APPS_NAMESPACE

oc annotate --overwrite svc accountprofile prometheus.io/scrape='true' prometheus.io/port='8080' prometheus.io/path=/actuator/prometheus -n $APPS_NAMESPACE
The metrics configuration is automatically done for the Camel service (customerservice) in Payment Gateway when we use the mvn command to build and deploy the Camel service. Please refer this article for detail of the customerservice.
Verifying Prometheus and Metrics Configurations
By default there is no OpenShift route created for Prometheus. In order to easily access to Prometheus console to verify it is working as expected, let’s logon to the OpenShift console and create a route for the Prometheus service.
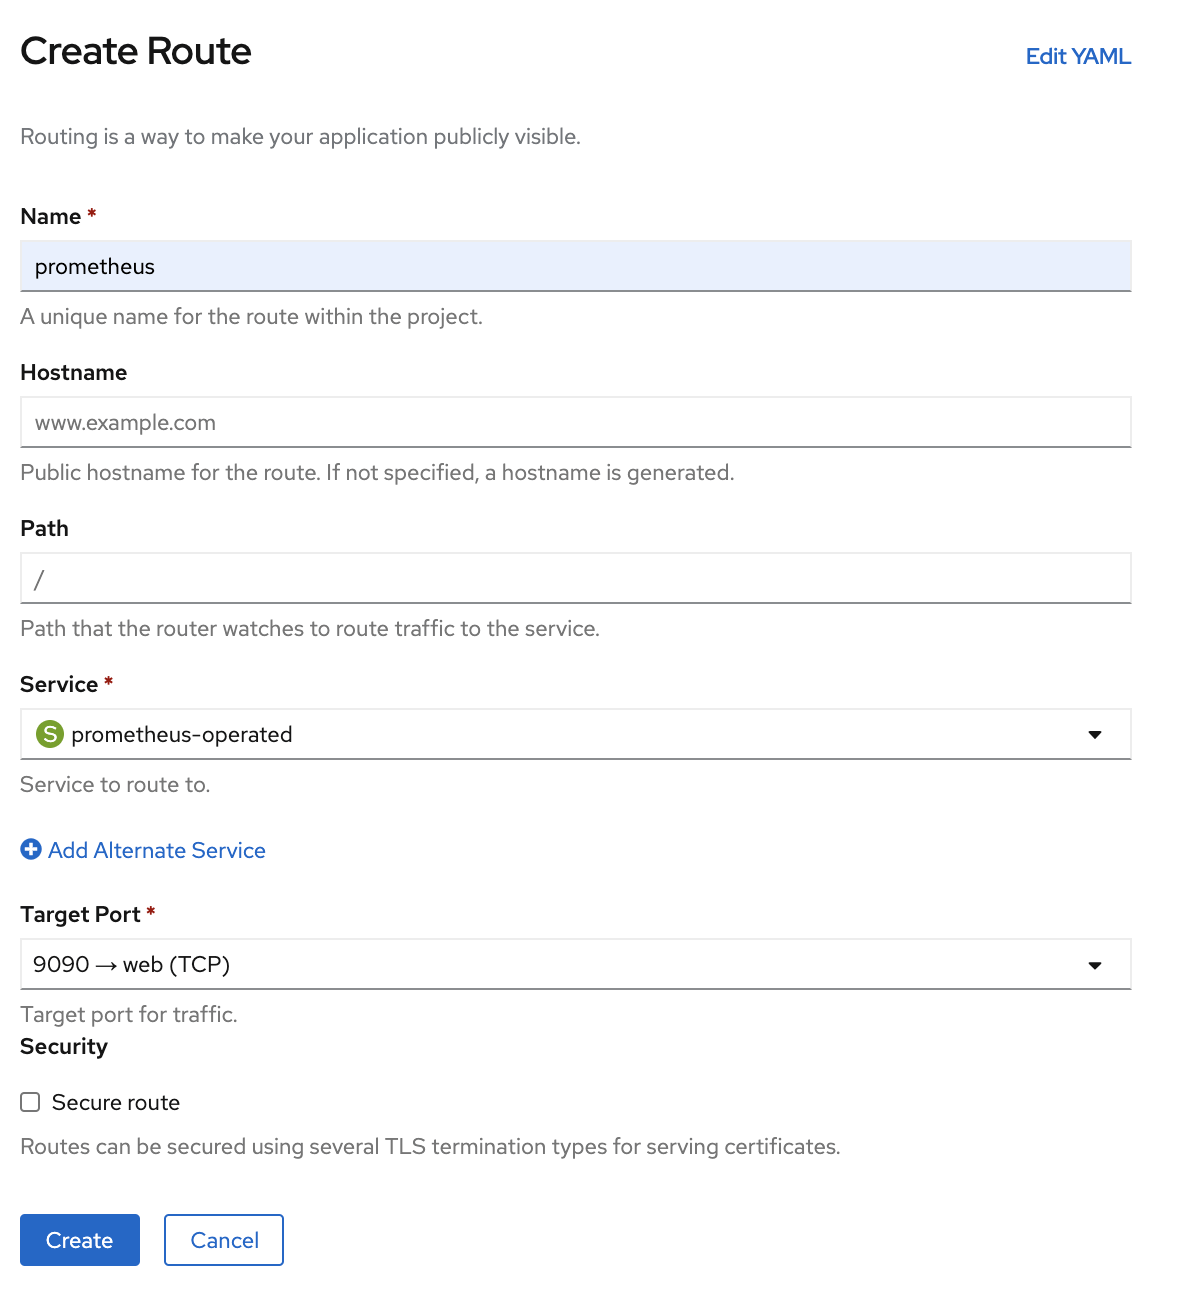
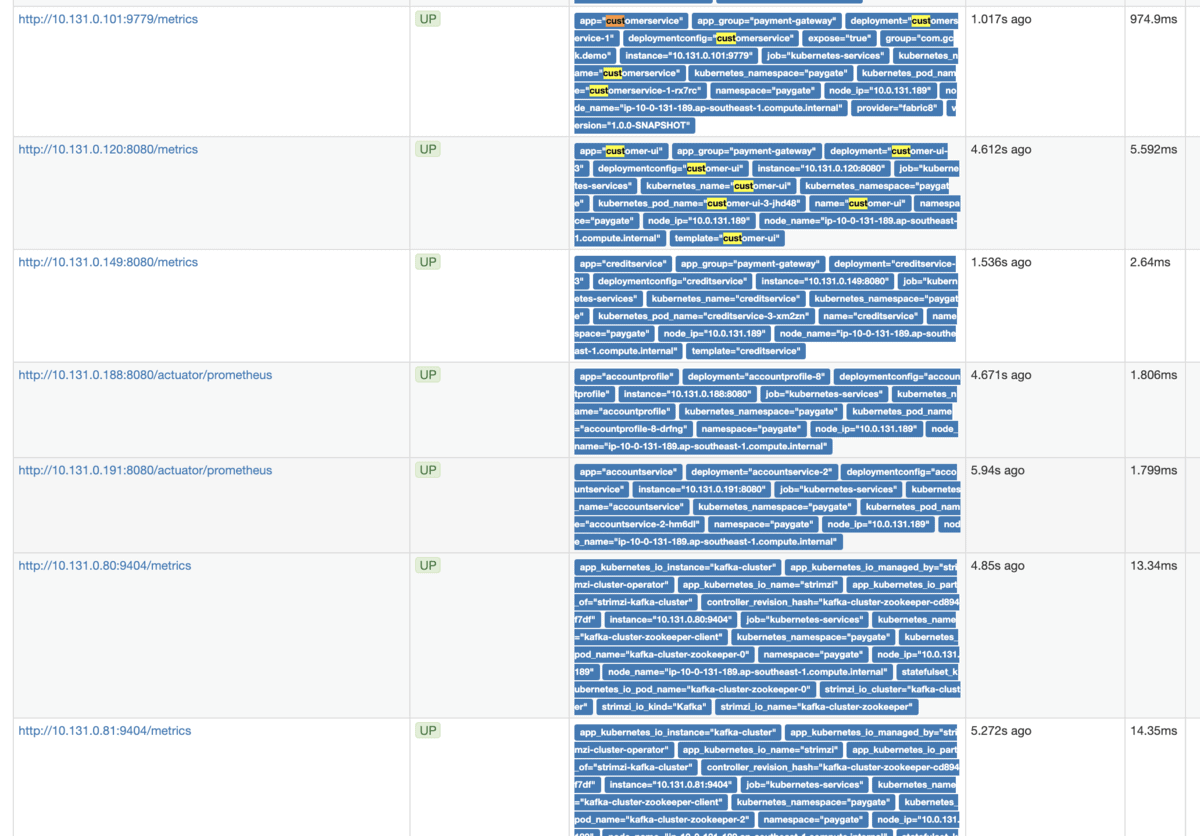
Click on the Prometheus route and logon with your OpenShift user. Verify that you can see various targets are discovered in Prometheus.
Configuring Grafana Dashboards
Once Grafana is ready, login to the Grafana using the default username and password which is admin/admin. It will prompt you to change the default password once login.
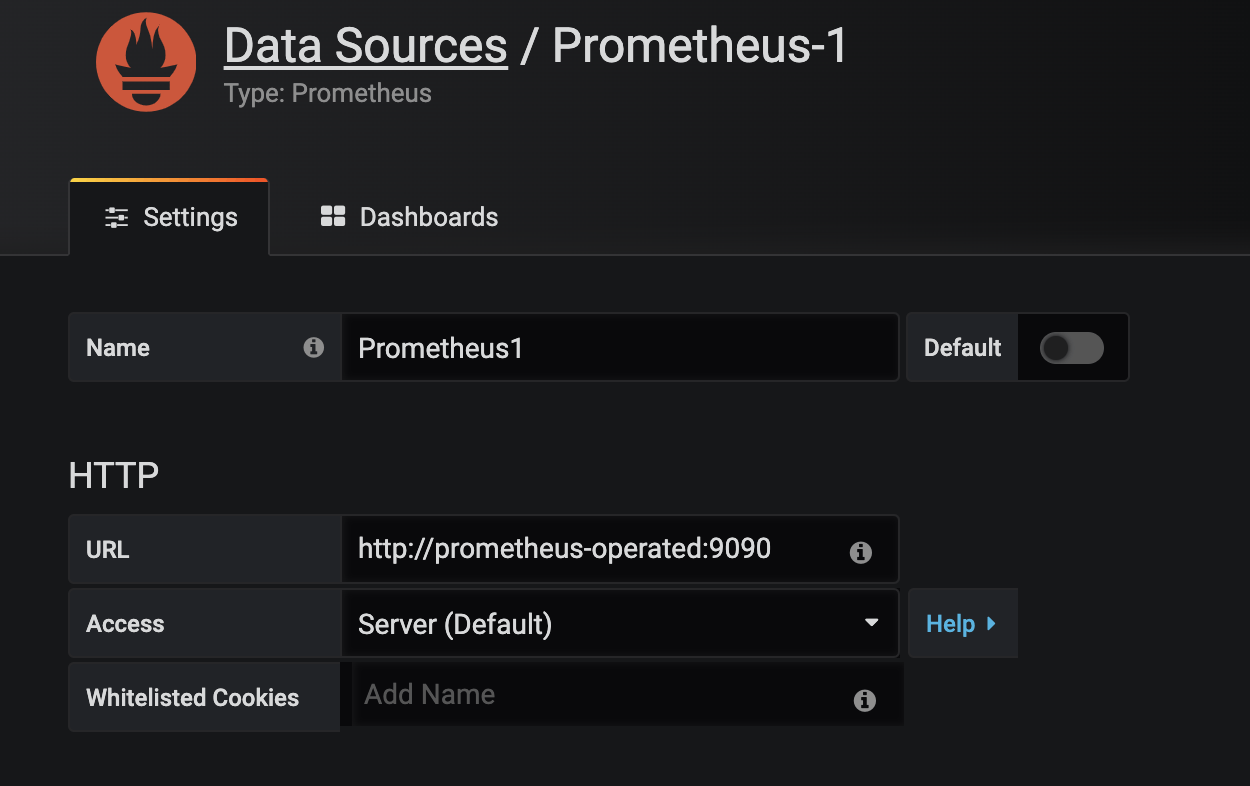
Create a Prometheus data source with the following URL for Prometheus. Accept all other default configurations and click Save & Test.
Modify the sample grafanadashboard_common_payment_gateway_overview.json to match your OpenShift project, i.e. replace paygate with your openShift project name.
"list": [
{
"current": {
"text": "paygate",
"value": "paygate"
},
"hide": 2,
"label": "Namespace",
"name": "namespace",
"options": [
{
"selected": true,
"text": "paygate",
"value": "paygate"
}
],
"query": "paygate",
"skipUrlSync": false,
"type": "constant"
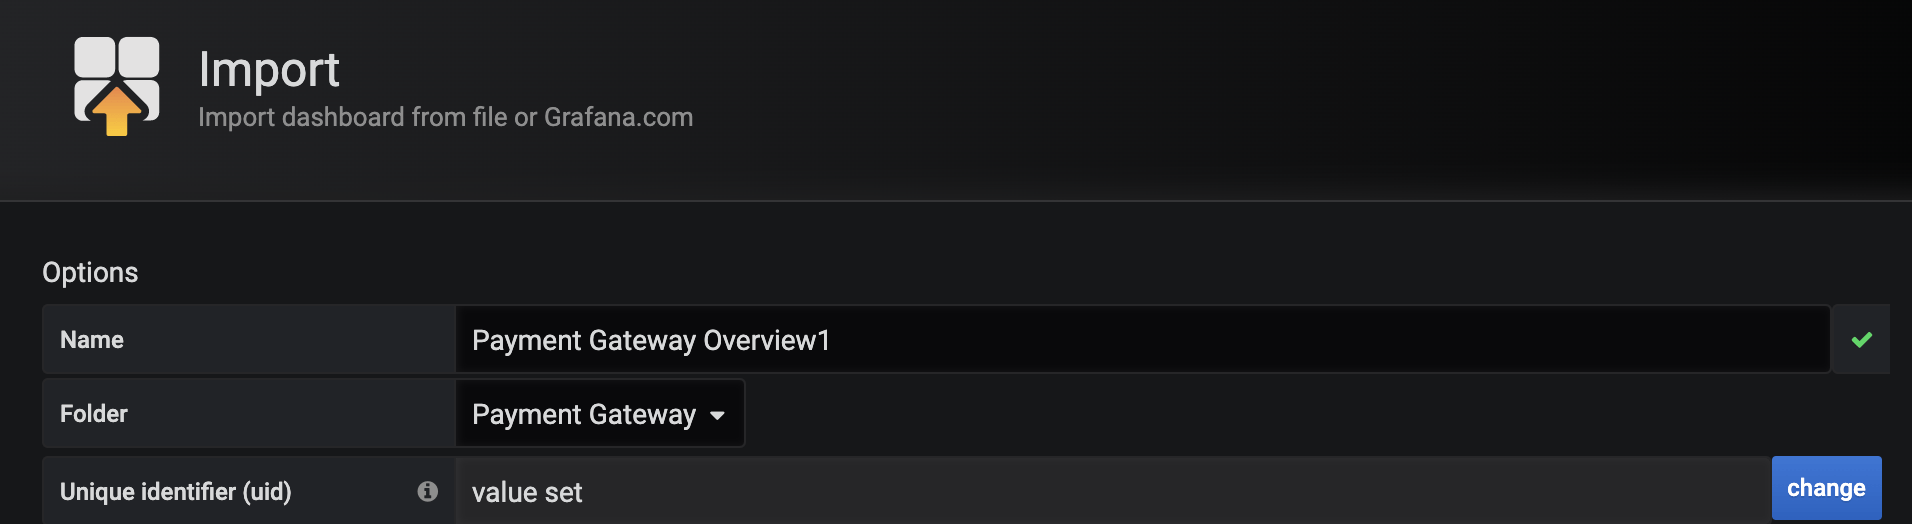
},Import the above dashboard configuration into Grafana. You may choose to create a folder to group these Payment Gateway dashboards.
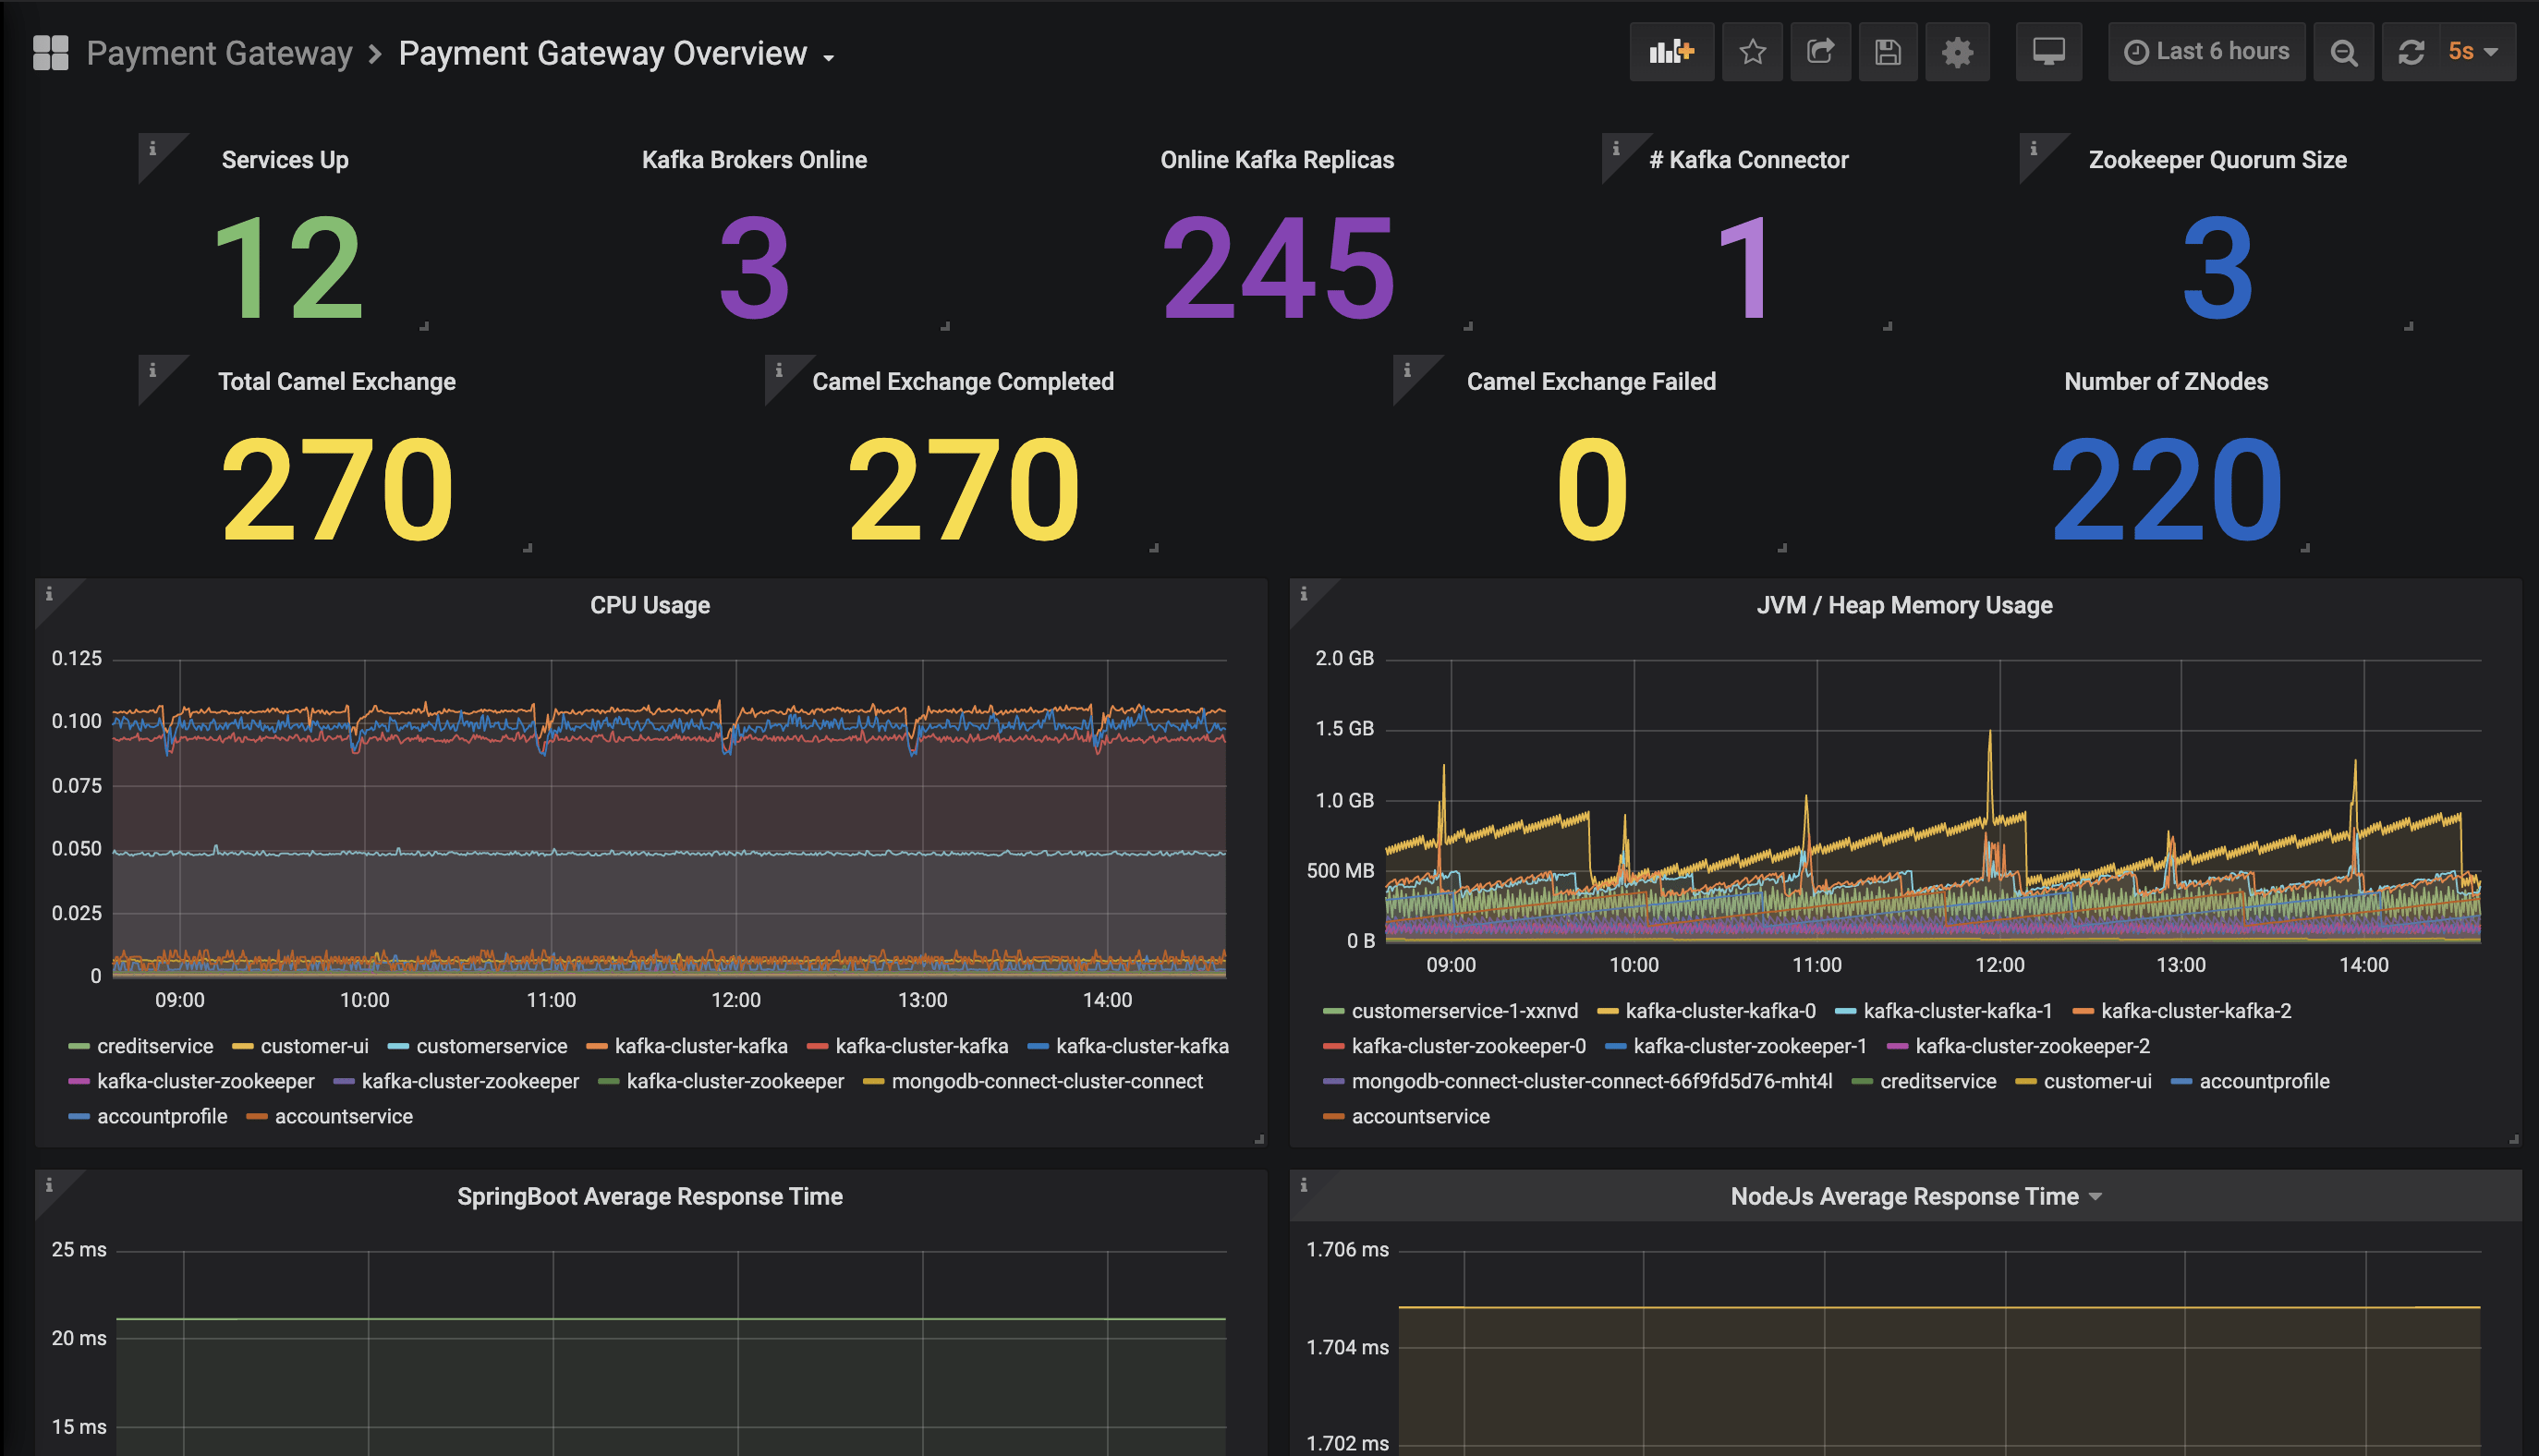
You will see the following dashboard once it is imported.
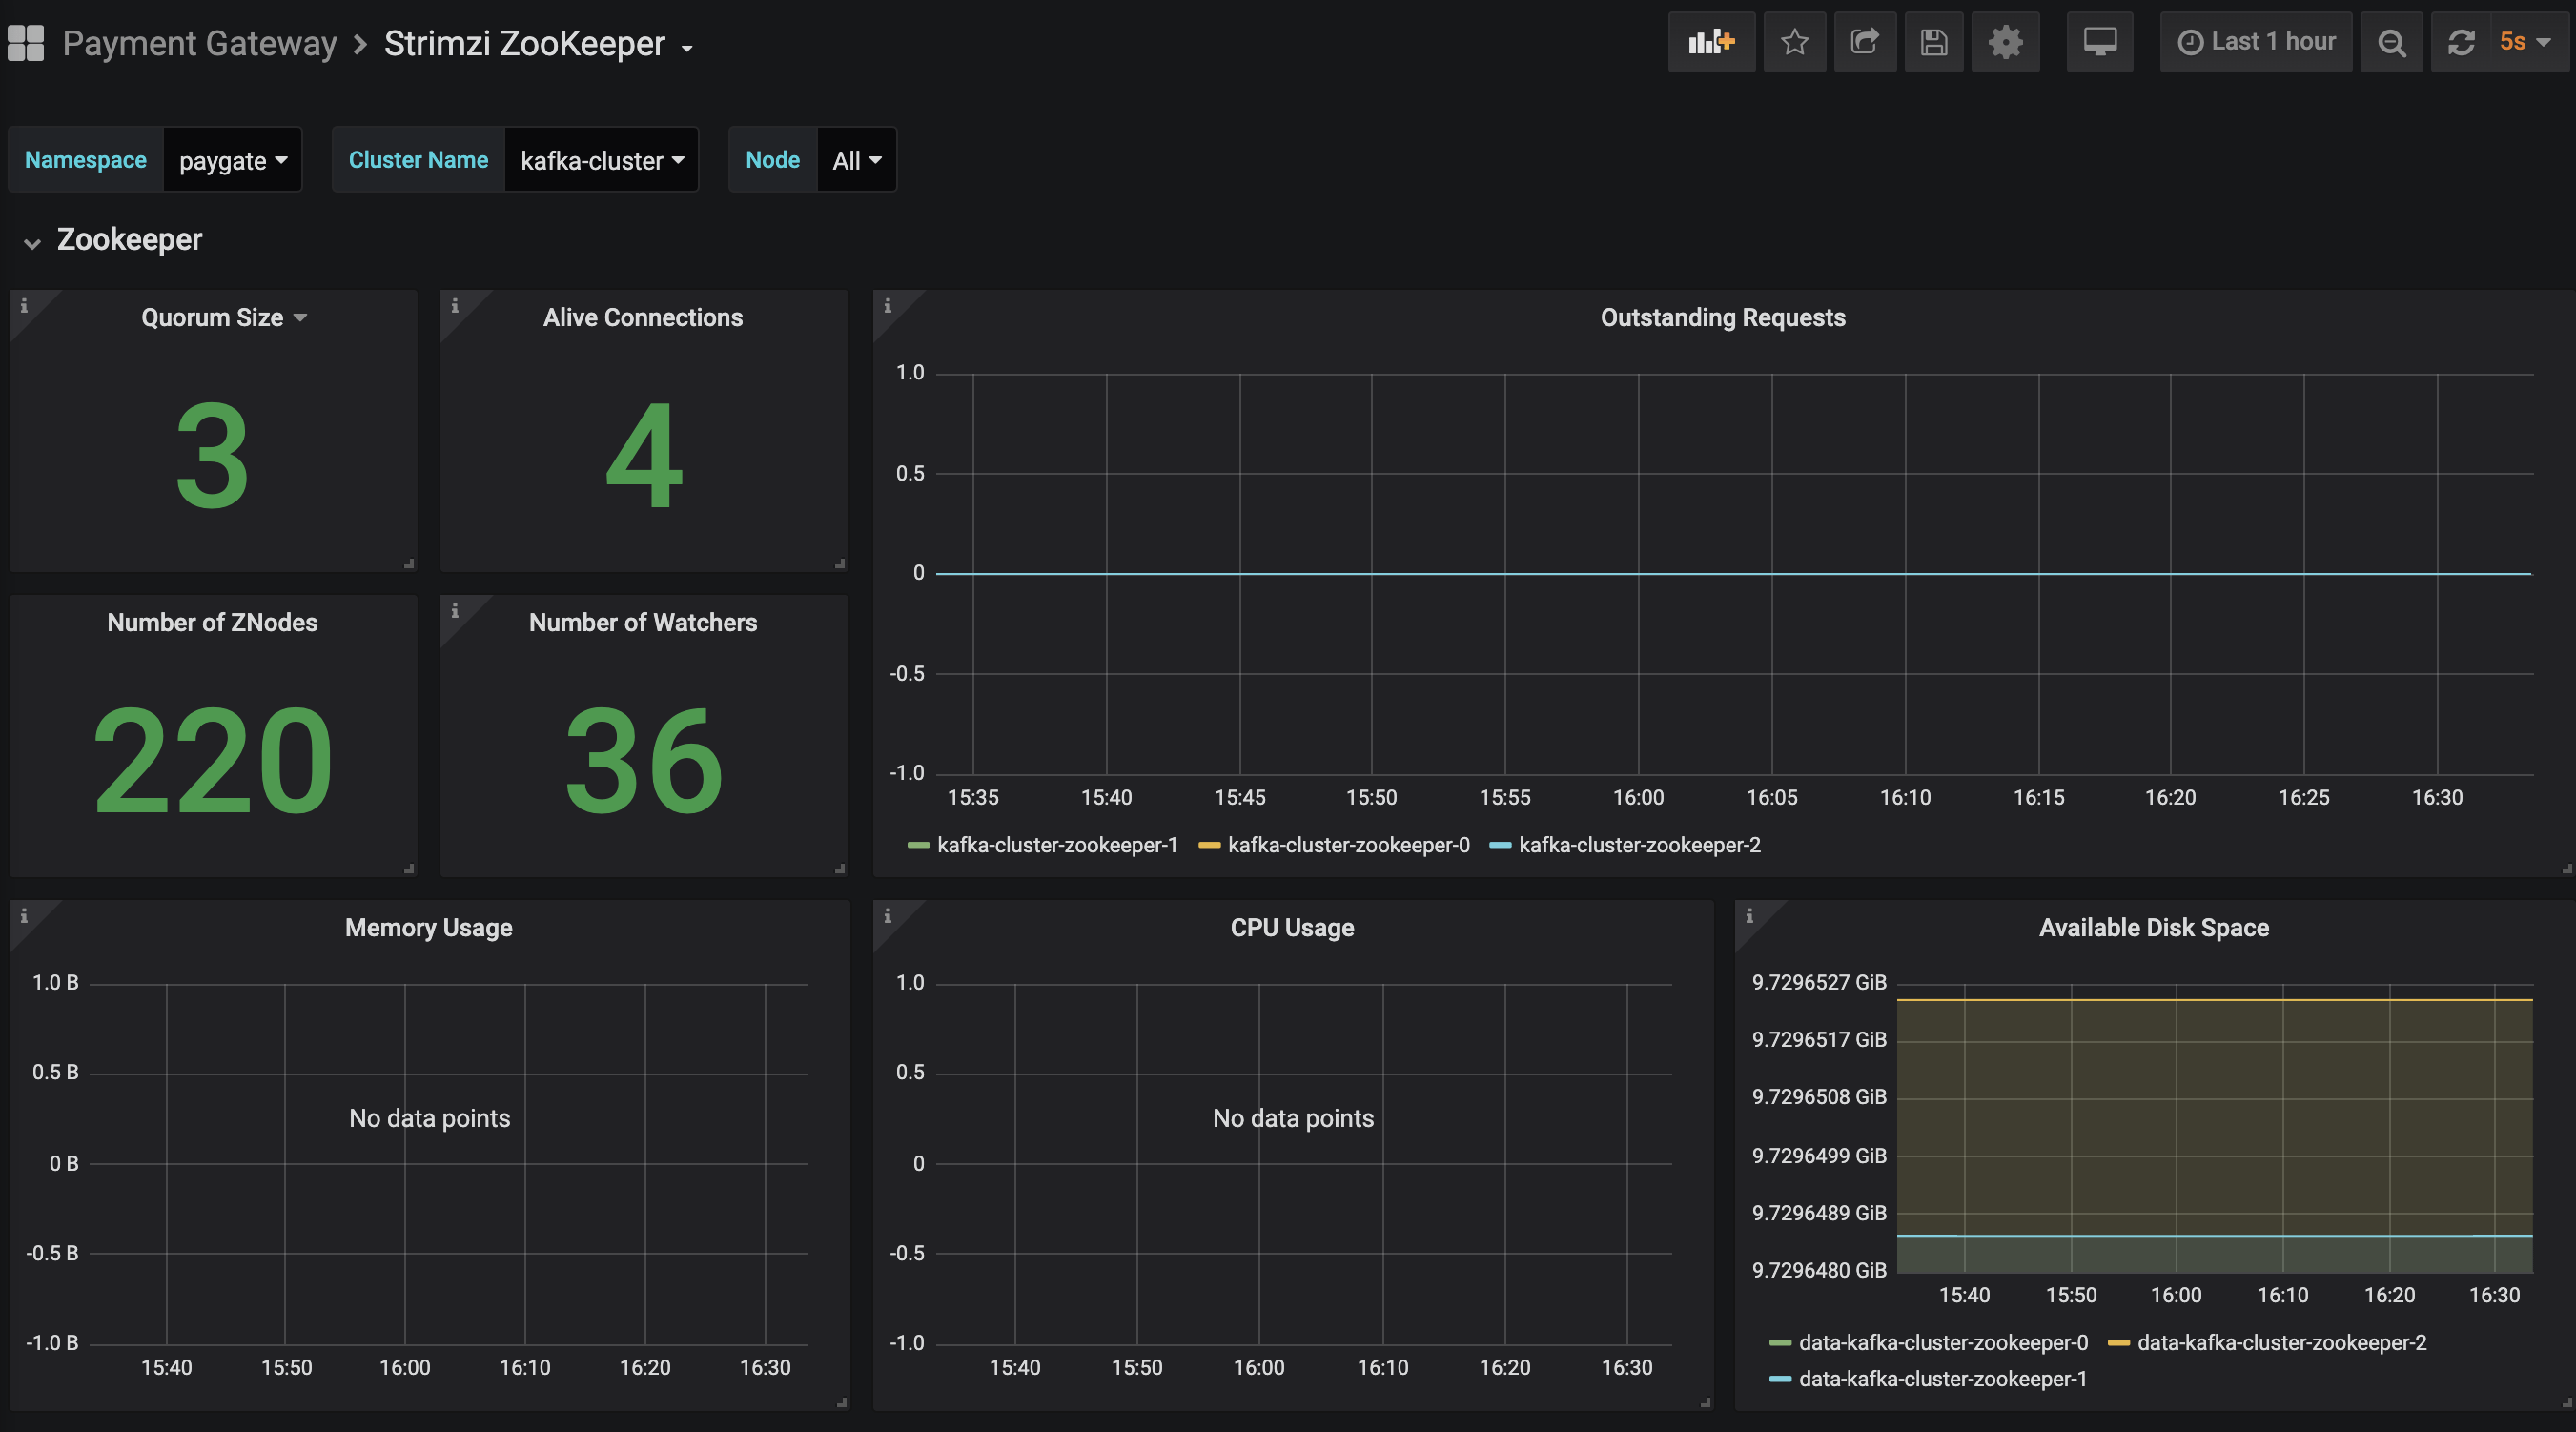
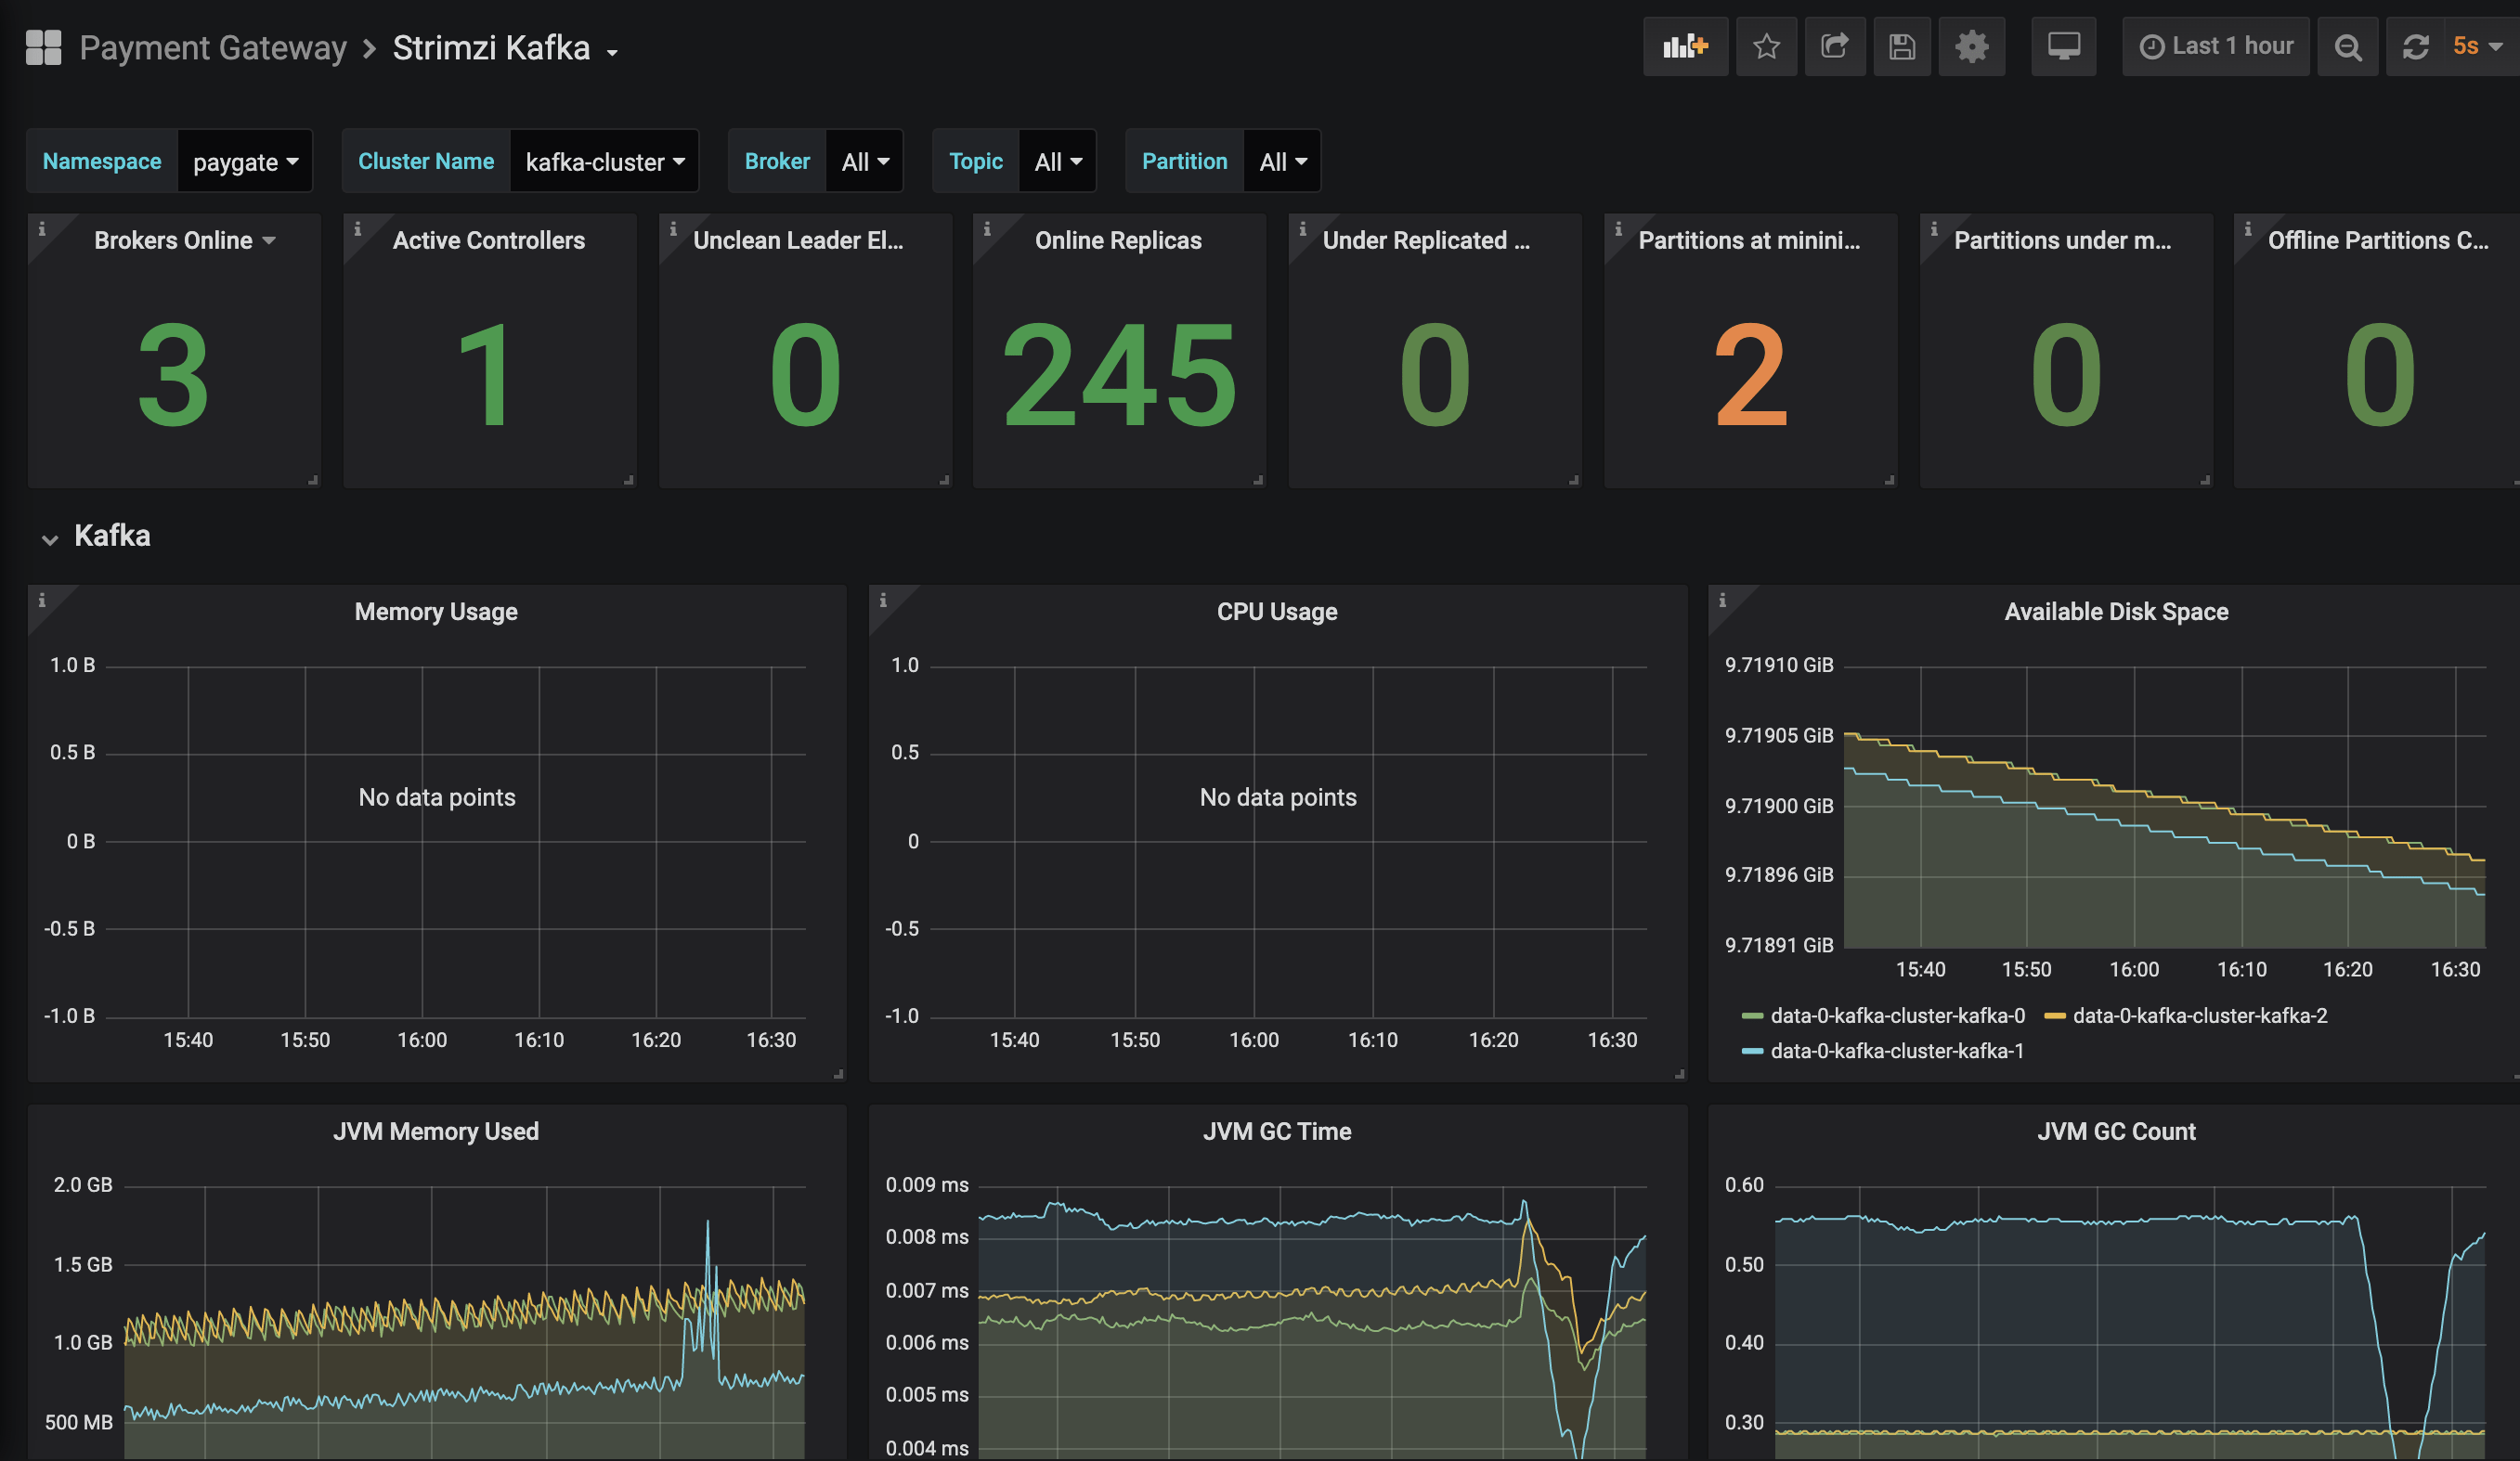
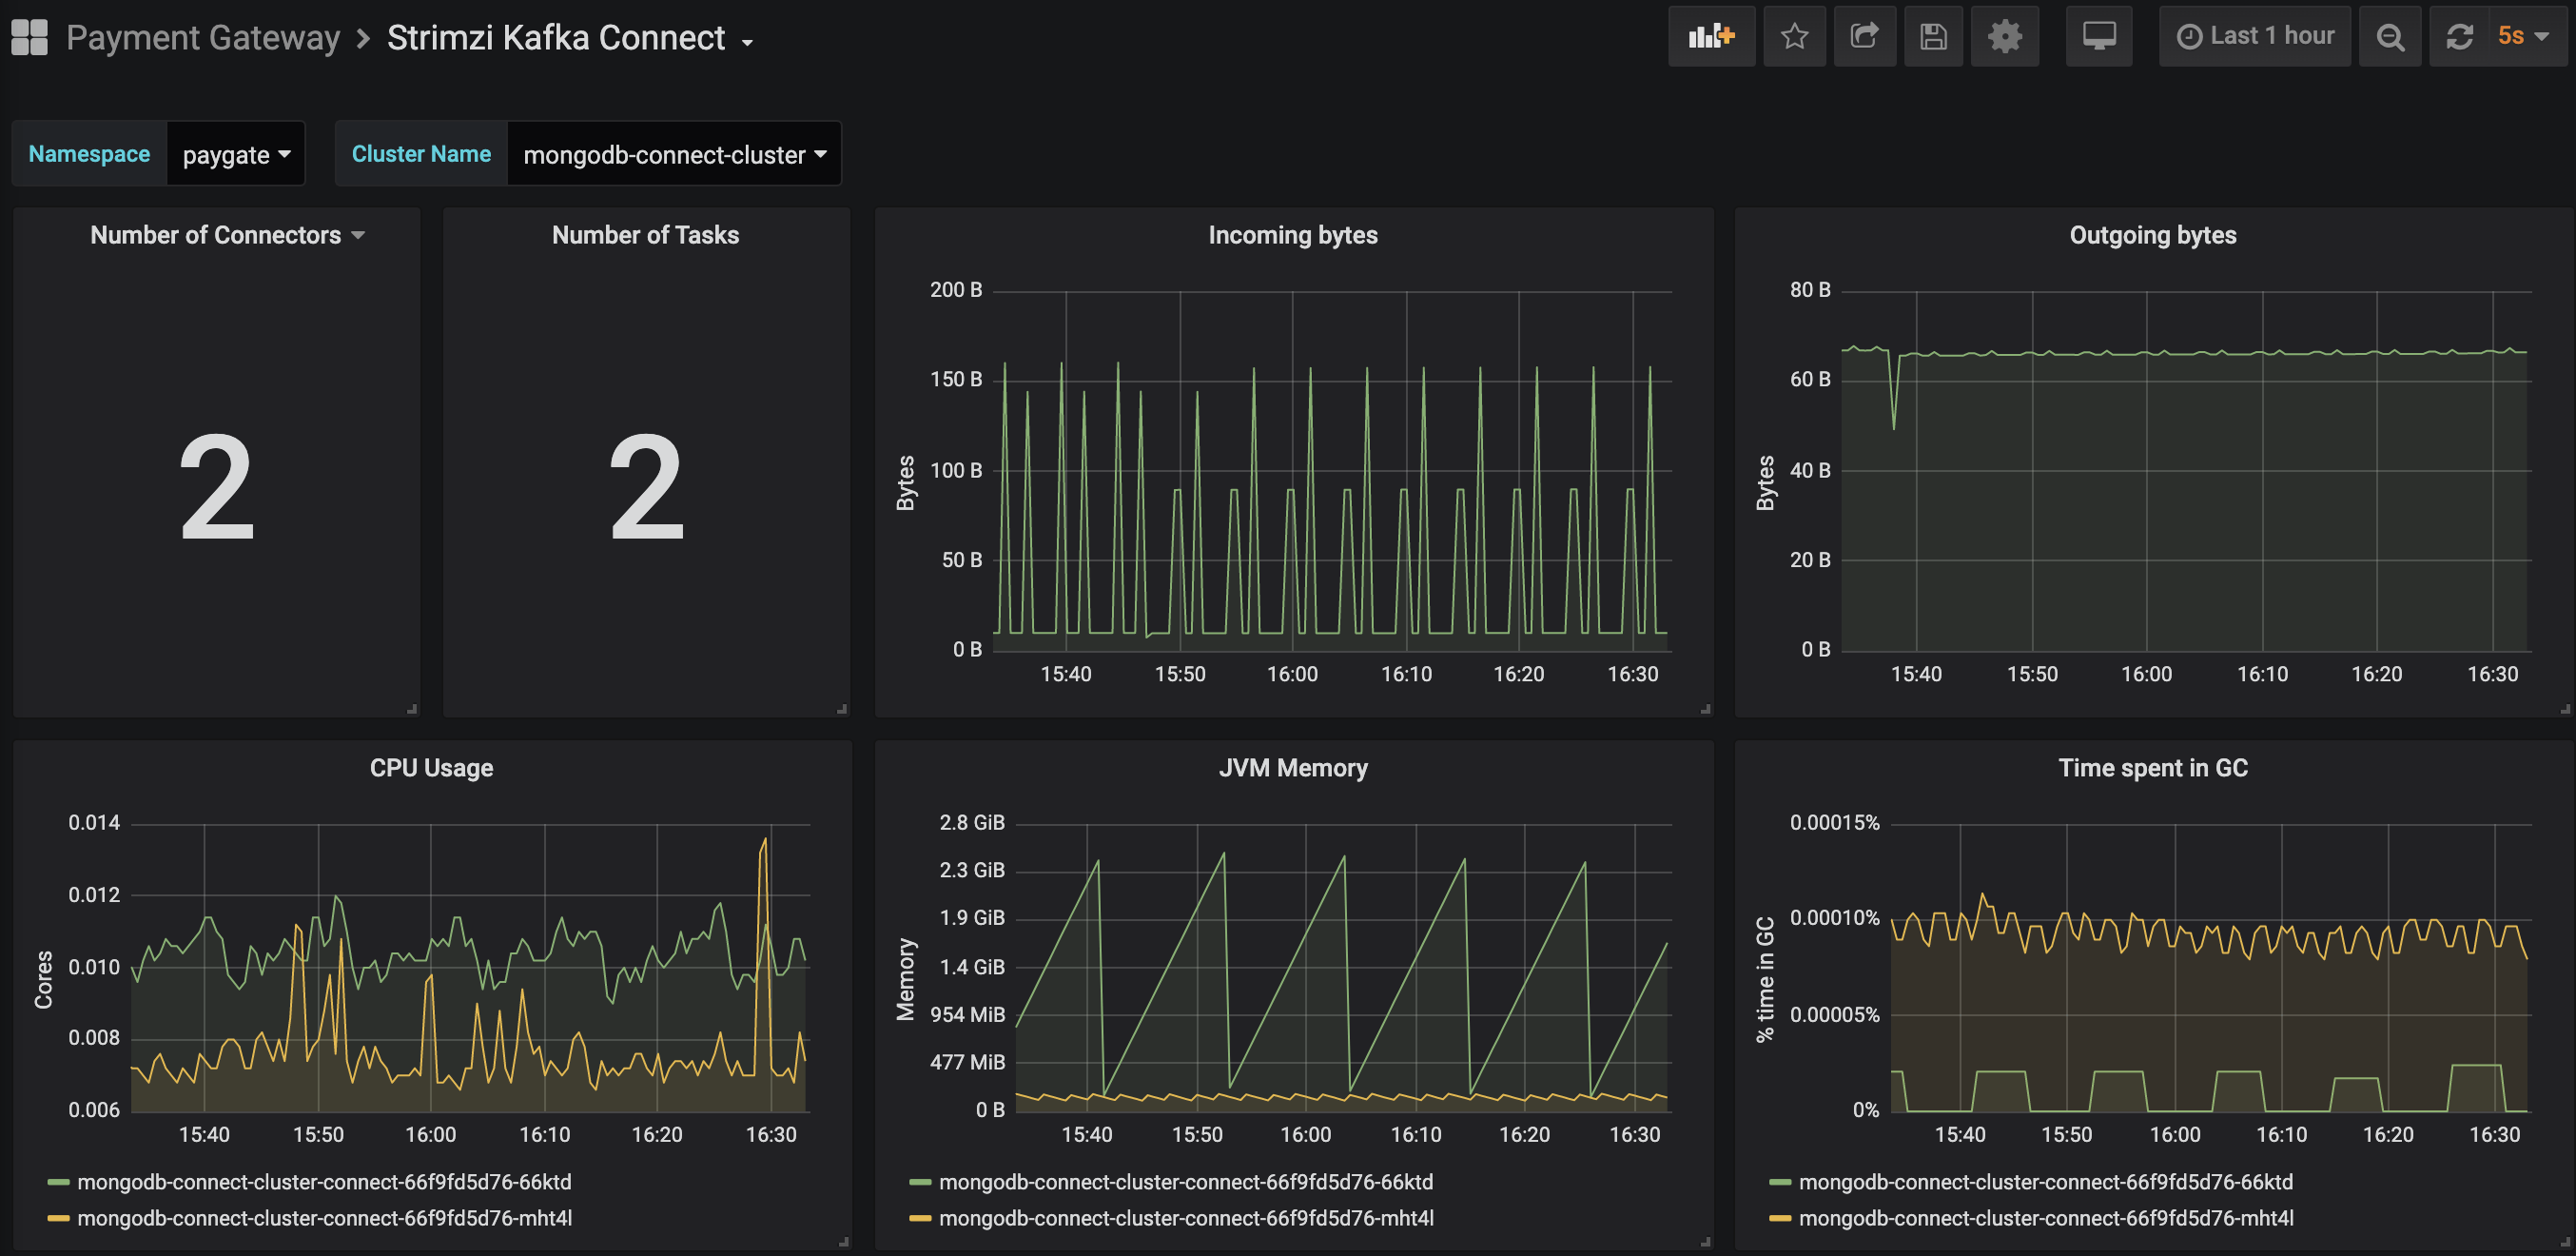
Proceed to import the other dashboards for Red Hat AMQ Streams from here. You may also refer the guide from Red Hat AMQ Streams documentation. Once you have done the dashboard imports, you will see the following.
Summary
In short, it seems there are a lot of steps to enable application resource monitoring in OpenShift. The truth is most of them have been simplified with Operator Hub, Prometheus Operator and OpenShift, comparing if you have to do it manually. In fact, these are one time setup on OpenShift, once you have them running, your application team will just need to focus on application development and at the same being able to get performance feedback from Prometheus on OpenShift.
If you will like to skip all the steps above to experience the goodness of Prometheus and OpenShift, head to the GitHub and follow the installation guide to install this Payment Gateway. The demo installer will install all of the above for you in one command line.